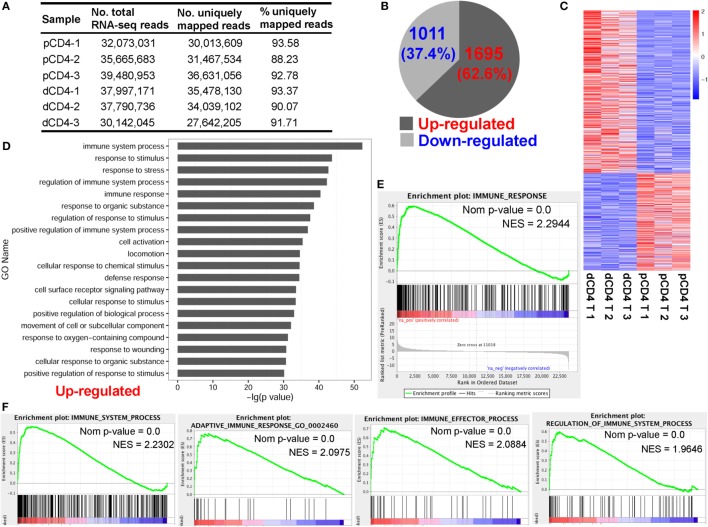
Figure 1.
Human dCD4 T cells show a distinct transcriptional signature and upregulate genes related to immune system process as compared with autologous pCD4 T cells. Three healthy women at the first trimester of normal pregnancy were recruited and their dCD4 and pCD4 T cells were isolated by fluorescence-activated cell sorting (FACS). (A) Summary of mRNA-Seq data for the purified dCD4 and pCD4 T cells. RNA samples of paired dCD4 and pCD4 T cells from three individuals were sequenced on the Illumina Hiseq 2500 platform, yielding approximately 30–40 million 2 × 125-bp paired-end reads per sample, which were then mapped to the human reference genome (hg19 version). (B) Number and percentage of the differentially expressed genes (P < 0.05, paired test) that were upregulated or downregulated in dCD4 T cells versus their pCD4 T counterparts. (C) Heatmap of differentially expressed genes. Each line represents one gene. Each column represents one sample. Different colors represent the expression levels (from blue to red: increased expression). (D) Functional enrichment of the upregulated genes in dCD4 T cells by GO annotation of biological process. The top 20 GO terms are listed. (E,F) GSEA plots of GO categories including immune response (E), immune system process, adaptive immune response, immune effector process, and regulation of immune system process (F) in dCD4 versus pCD4 T cells. dCD4 T, decidual CD4+ T; pCD4 T, peripheral blood CD4+ T; No., number; %, percentage; GO, Gene Ontology; GSEA, gene set enrichment analysis; Nom, Nominal; NES, Normalized Enrichment Score.

