Figure 2.
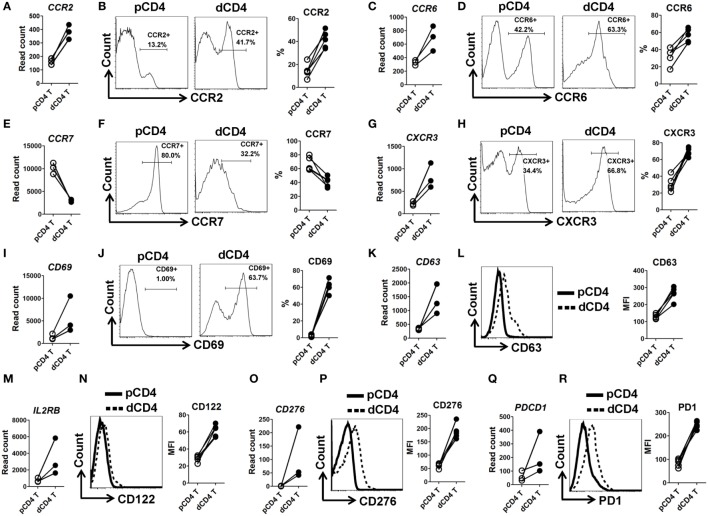
Validation of mRNA-Seq data by flow cytometry staining. (A,C,E,G,I,K,M,O,Q) Comparison of the gene expression (measured as the read count) of CCR2, CCR6, CCR7, CXCR3, CD69, CD63, IL2RB, CD276, and PDCD1 between paired pCD4 and dCD4 T cells. Each symbol reflects a sample and each line reflects samples from the same individual (n = 3 per group). (B,D,F,H,J,L,N,P,R) Representative flow cytometric histograms (left) and cumulative data (right) illustrating the comparison of molecular expression of indicated proteins between paired pCD4 and dCD4 T cells (n = 5 per group). The cells were gated in CD4+ T cells and the geometric MFI values were calculated using FlowJo 7.6.1 software. pCD4 T, peripheral blood CD4+ T; dCD4 T, decidual CD4+ T; %, percentage; MFI, mean fluorescent intensity.

