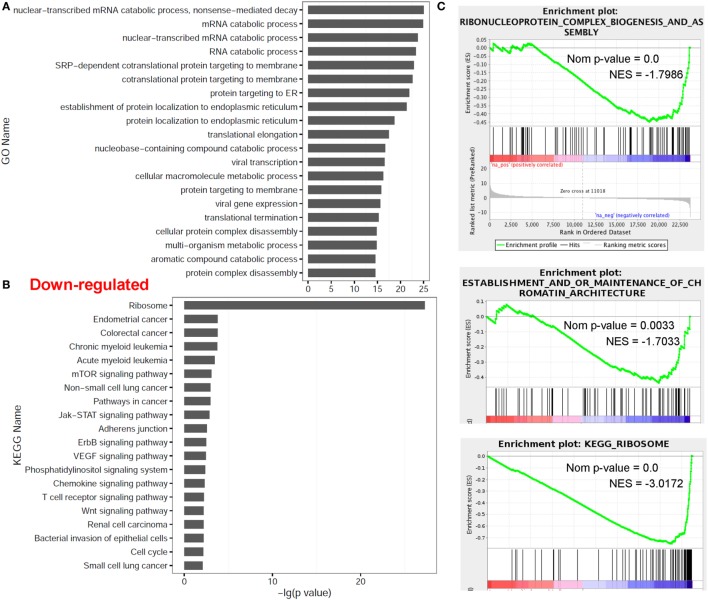
Figure 3.
Functional enrichment analyses for genes downregulated in dCD4 versus pCD4 T cells. (A,B) The top 20 GO and KEGG terms enriched for downregulated genes in dCD4 versus pCD4 T cells. (C) GSEA plots of GO/KEGG categories including ribonucleoprotein complex biogenesis and assembly, establishment and/or maintenance of chromatin architecture, and ribosome. GO, Gene Ontology; KEGG, Kyoto Encyclopedia of Genes and Genomes; GSEA, gene set enrichment analysis; Nom, Nominal; NES, Normalized Enrichment Score.

