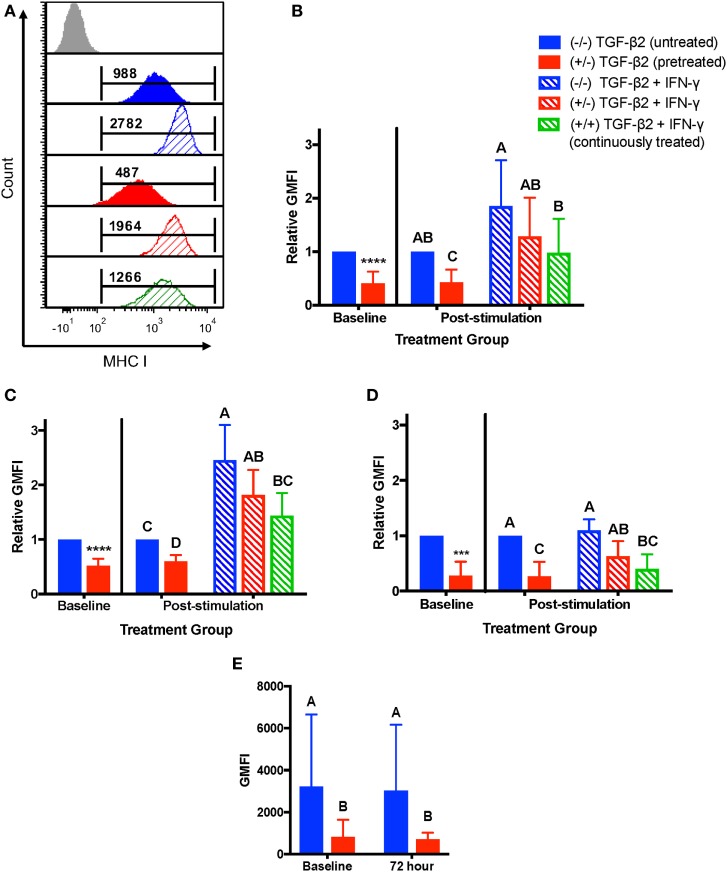
Figure 4.
Major histocompatibility complex (MHC) I surface expression on untreated and transforming growth factor-β2 (TGF-β2)-treated mesenchymal stem cells (MSCs) following IFN-γ stimulation. P3 untreated (−/−), TGF-β2-pretreated (+/−), and TGF-β2 continuously treated (+/+) MSCs were stimulated with 1 ng/ml IFN-γ for 72 h before MHC I expression analysis via FACS. Untreated and pretreated MSCs not stimulated with IFN-γ were used as controls. Superscript letters indicate significant differences between groups. (A) Representative histograms from one horse of MHC I expression for all treatment groups. Numbers above gates represent population geometric mean fluorescence intensity (GMFI) compared to MHC I negative control (gray). (B) MHC I expression shown as the average fold change in GMFI relative to the control group (−/− TGF-β2 untreated, solid blue bar). Data shown are mean ± SD of n = 9, *p < 0.0001 by t-test, p < 0.0001 by analysis of covariance (ANCOVA). (C) MHC I expression for MHC I low horses shown as the average fold change in GMFI relative to the control group (−/− TGF-β2 untreated, solid blue bar). Data shown are mean ± SD of n = 5, *p < 0.0001 by t-test, p < 0.0001 by ANCOVA. (D) MHC I expression for MHC I high horses shown as the average fold change in GMFI relative to the control group (−/− TGF-β2 untreated, solid blue bar). Data shown are mean ± SD of n = 4, *p = 0.0049 by t-test, p < 0.0001 by ANCOVA. (E) MHC I GMFI of baseline and unstimulated MSCs treatment groups. Data shown are mean ± SD of n = 9, p < 0.0001.

