Figure 5.
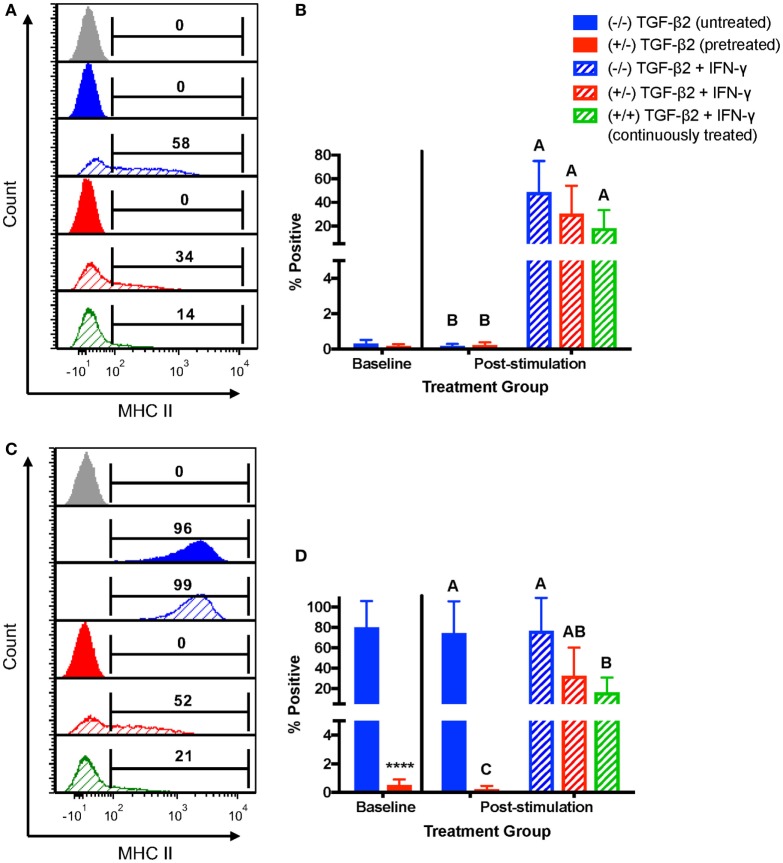
Major histocompatibility complex (MHC) II surface expression on untreated and transforming growth factor-β2 (TGF-β2)-treated mesenchymal stem cells (MSCs) following IFN-γ stimulation. P3 untreated (−/−), TGF-β2-pretreated (+/−), and TGF-β2 continuously treated (+/+) MSCs were stimulated with 1 ng/ml IFN-γ for 72 h before MHC II expression analysis via FACS. Untreated and pretreated MSCs not stimulated with IFN-γ were used as controls. Superscript letters indicate significant differences between groups. (A) Representative histograms from one MHC II baseline negative horse showing MHC II expression for all treatment groups. Numbers above gates represent the percent of the parent population positive for MHC II compared to the negative control (gray). (B) MHC II expression shown as the average percent of the parent population positive for MHC II relative to the control group (−/− TGF-β2 untreated, solid blue bar). Data shown are mean ± SD of n = 6, p < 0.0001. (C) Representative histograms from one MHC II baseline positive horse showing MHC II expression for all treatment groups. Numbers above gates represent the percent of the parent population positive for MHC II compared to the negative control (gray). (D) MHC II expression shown as the average percent of the parent population positive for MHC II relative to the control group (−/− TGF-β2 untreated, solid blue bar). Data shown are mean ± SD of n = 3, *p < 0.0001 by t-test, p < 0.0007 by analysis of covariance.

