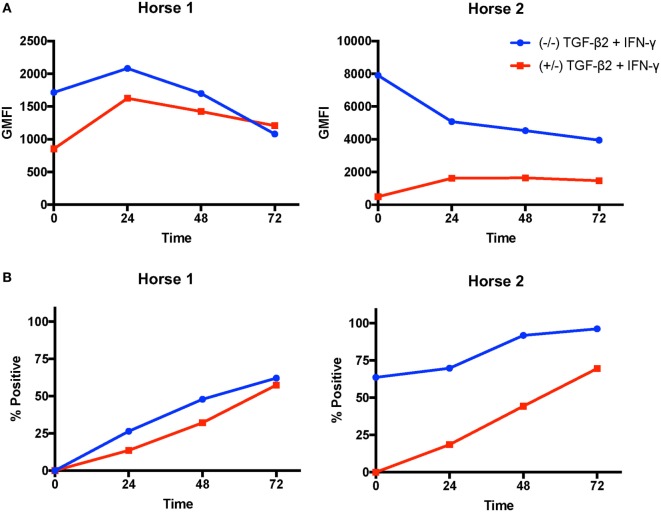
Figure 6.
Major histocompatibility complex (MHC) I and MHC II surface expression kinetics on untreated and transforming growth factor-β2 (TGF-β2)-pretreated mesenchymal stem cells (MSCs) following IFN-γ stimulation. MHC I and MHC II expression were measured on untreated and TGF-β2-pretreated MSCs from two horses via FACS every 24 h for 72 h following IFN-γ stimulation. (A) MHC I expression shown as the geometric mean fluorescence intensity (GMFI) of MSCs in each treatment group over time. (B) MHC II expression shown as the percent of the parent MSC population positive for MHC II in each treatment group over time.

