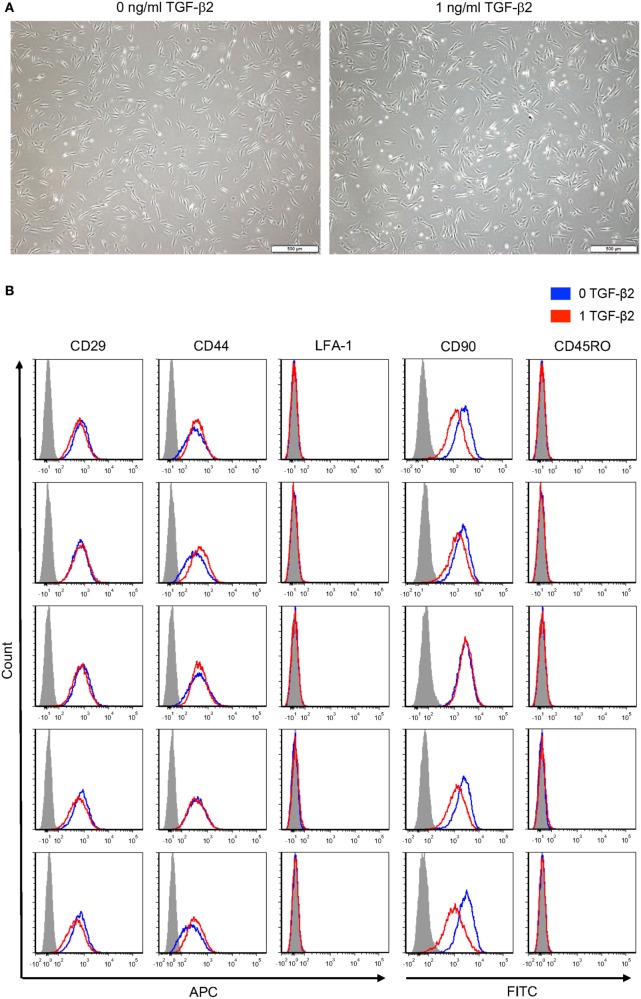
Figure 7.
Phenotype of untreated and transforming growth factor-β2 (TGF-β2)-treated mesenchymal stem cells (MSCs). (A) P2 MSCs were imaged via phase microscopy, bar = 500 µM. (B) P3 untreated and TGF-β2-treated MSCs were stained for positive MSC surface markers CD29, CD44, and CD90 and negative surface markers LFA-1 and CD45RO. Expression is shown as FACS histograms from five horses.

