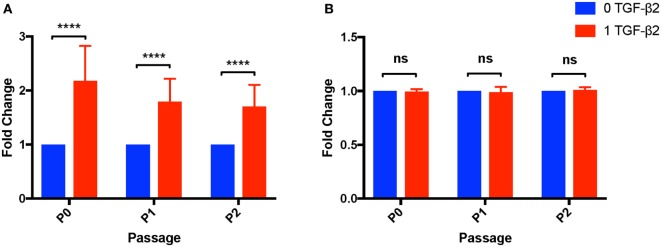
Figure 8.
Cell yield and viability of untreated and transforming growth factor-β2 (TGF-β2)-treated mesenchymal stem cells (MSCs). Cell yield and viability were determined at each passage using a Cellometer® Auto 2000 and ViaStain™ AOPI Staining Solution. (A) Cell yield is displayed as the average fold change in cell counts relative to untreated MSCs. Data shown are mean ± SD of n = 8, ****p < 0.0001 by t-test (B) Viability is displayed as the average fold change in percent viability of MSCs relative to untreated MSCs. Data shown are mean ± SD of n = 8.

