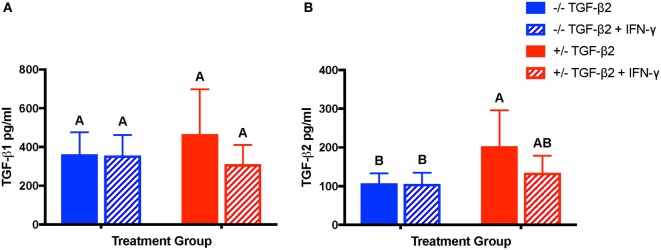
Figure 9.
Production of TGF-β1 and transforming growth factor-β2 (TGF-β2) by untreated and TGF-β2-treated mesenchymal stem cells (MSCs). TGF-β1 and TGF-β2 concentrations were measured in the supernatant of untreated (−/− TGF-β2), untreated and IFN-γ stimulated (−/− TGF-β2 + IFN-γ), TGF-β2-pretreated (+/− TGF-β2), and TGF-β2-pretreated and IFN-γ stimulated (+/− TGF-β2 + IFN-γ) MSCs using a TGF-β multiplex assay. Superscript letters indicate significant differences between groups. (A) TGF-β1 is displayed as the mean concentration ± SD of n = 7. (B) TGF-β2 is displayed as the mean concentration ± SD of n = 7, p = 0.0045 by analysis of covariance.

