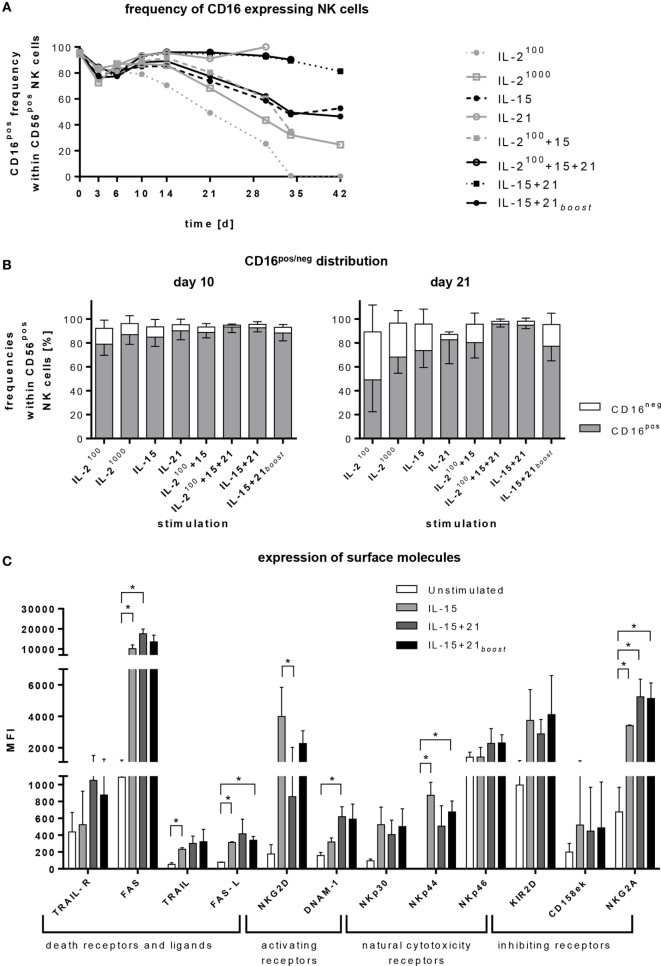
Figure 2.
Regulation of surface markers. Purified CD56posCD3neg cells were cultivated for 4–6 weeks with different cytokines or cytokine combinations. (A) At indicated time points, frequencies of CD16pos natural killer (NK) cells were assessed by flow cytometry. The graph represents means of 5–11 independent donors. (B) The graphs show the distribution of CD16pos cells and their CD16neg counterpart within CD56pos NK cells on days 10 and 21. Bars represent mean values of 5–11 independent donors, lines indicate SDs. (C) Expression of various activating and inhibitory receptors after 6 days of cultivation is shown for selected protocols. Bars represent mean values of three independent donors, lines indicate SDs. Significant differences are indicated by asterisks (*p < 0.05, one-way ANOVA).

