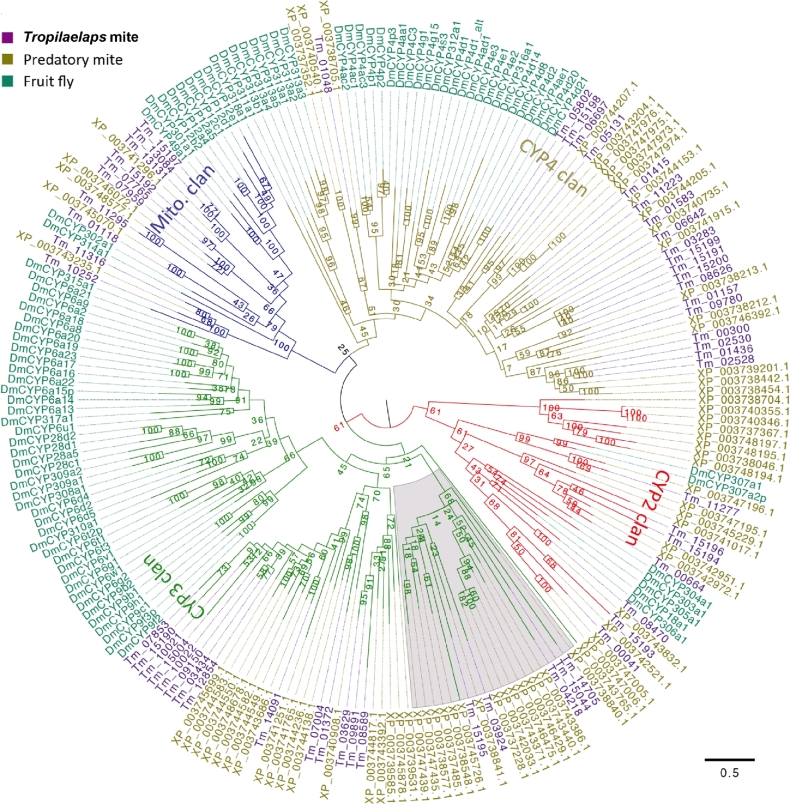
Figure 4:
Phylogeny of T. mercedesae, M. occidentalis, and D. melanogaster cytochorme P450. The phylogenetic tree was constructed by maximum likelihood method and rooted at the middle point. P450s are clustered to CYP2, CYP3, CYP4, and mitochondrial clans are shown by red, green, blue, and dark yellow branches, respectively. D. melanogaster (DmCYP), T. mercedesae, and M. occidentalis P450s are indicated by dark green, purple, and dark yellow, respectively. T. mercedesae and M. occidentalis P450s are designated by protein IDs.

