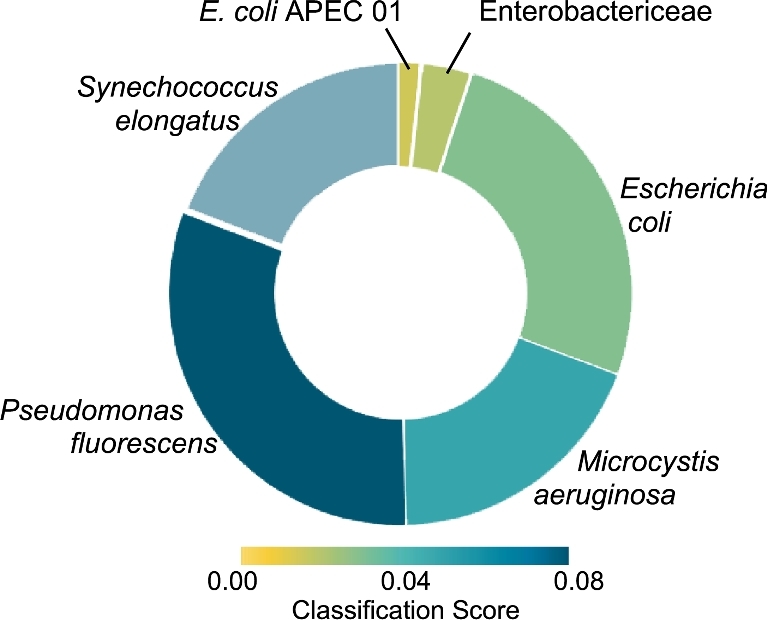
Figure 1:

Result of “What's in my pot” analysis of a mixture with equal DNA mass from four bacterial strains. Rendering of real-time analysis using WIMP [20] of WGSs from a synthetic mixture prepared from equal DNA quantities of four cultured microbe species (experiment ‘Equal’ in Tables 1 and 2) and run on the MinION™ sequencing platform. Arc angle is proportional to the number of reads assigned to the indicated species. Colors (scale at bottom of diagram) refer to the classification score threshold (for this analysis, the threshold for inclusion was 0.01).
