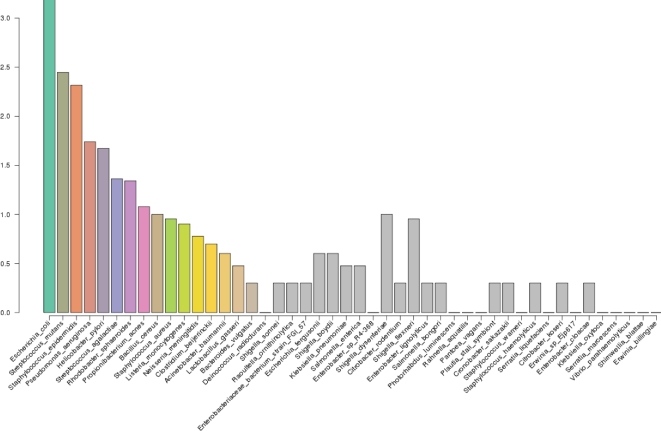
Figure 3:
Log abundance of reads assigned from staggered mixture. DNA of 20 species mixed in various proportions (BEI Resources, ATCC, HM-783D, operon counts μL−1 in original mixture indicated along bottom margin of bars) was preamplified with Φ29 polymerase prior to library preparation and sequenced with MinION™ R7.3 flow cells. The 2D reads that passed quality filtering were assigned to taxa using Kraken. Colored bars are species included in the mix, whereas gray bars indicate species detected but not included in the original DNA mixture.

