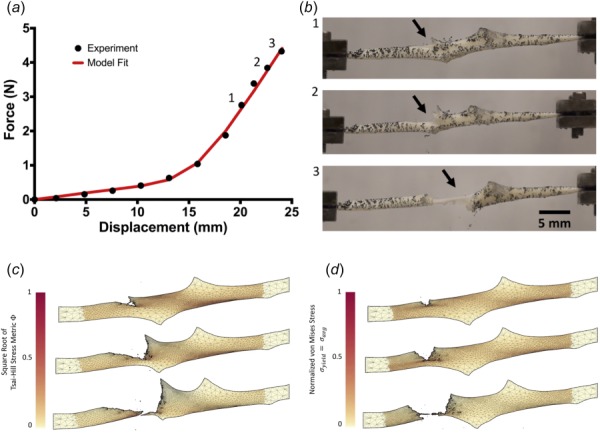
Fig. 6.

(a) Representative force–displacement curve for one shear lap sample (black dots), with a simulation force–displacement curve (red line) using optimized parameters. (b) Failure propagation for one shear lap sample, shown at three different displacements. The onset of failure began near the overlap region of the sample (indicated by the arrow) and propagated across the center (lap across failure). (c) Failure simulation using the Tsai–Hill criterion. Propagation occurred through the overlap region of the sample and eventually tore in the overlap region (lap across failure). (d) Failure simulation using the von Mises criterion, where . Failure propagated across the sample arm and tore the arm off (arm failure). Failure simulations are shown at similar failure points to the experiment but not at the same displacement as the experiment. (See supplementary videos, which are available under the “Supplemental Materials” tab for this paper on the ASME Digital Collection.)
