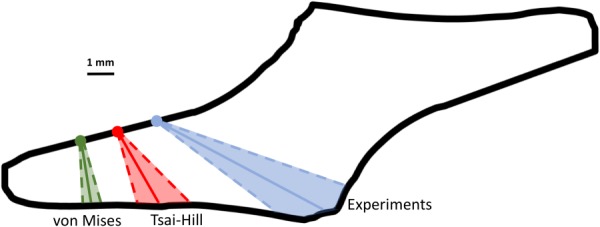
Fig. 9.

Average failure location (dots) and crack propagation angle (solid line) with 95%CI (dotted lines and shaded region) for experimental samples, Tsai–Hill, and von Mises (avg) failure simulations. Shown in black is the average shear lap sample geometry calculated using radius-based averaging from sample outlines (linear approximation was used for noisy regions of the average sample outline). Samples were rotated (if needed) so that failure occurred in the left arm for comparison purposes.
