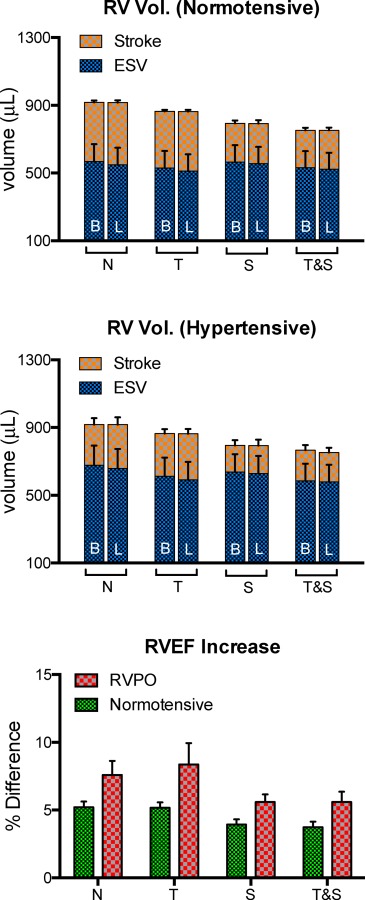
Fig. 7.

Per-animal (A1–A3) grouping of differences between baseline (B), and longitudinally aligned (L) fiber distribution. A small but consistent decrease in systolic volume was observed both in the normotensive (top) and the hypertensive (middle) groups. This change produced an increment in stroke volume, and, consequently, RVEF. The differences in RVEF (bottom) are more pronounced in the hypertensive group.
