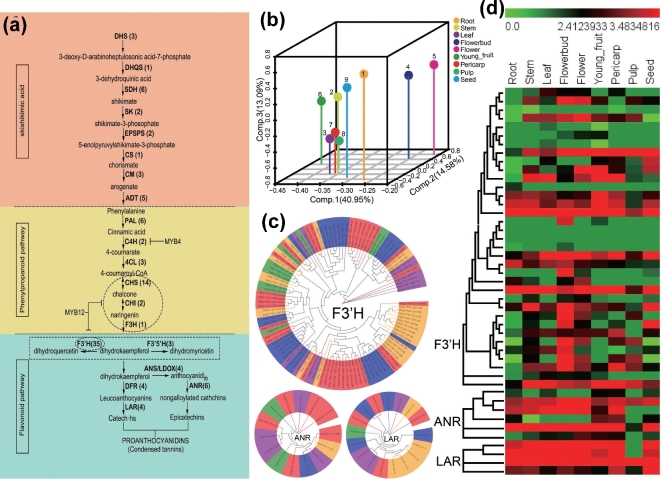
Figure 3:
Simplified diagram of the polyphenols biosynthetic pathway. (a) Simplified diagram of the polyphenols biosynthetic pathway. Numbers in brackets represent genes’ copy numbers. (b) PCA scatter plot of nine samples using genes related to the polyphenols biosynthetic pathway. (c) Neighbor-joining tree of the F3’H, ANR, and LAR from longan, peach, orange, Arabidopsis, and grape. (d) Cluster analysis of expression profiles of F3’H, ANR, and LAR. The bar represents the scale of relative expression levels of genes, and colors indicate relative signal intensities of genes. Each column represents a sample, and each row represents a single gene.

