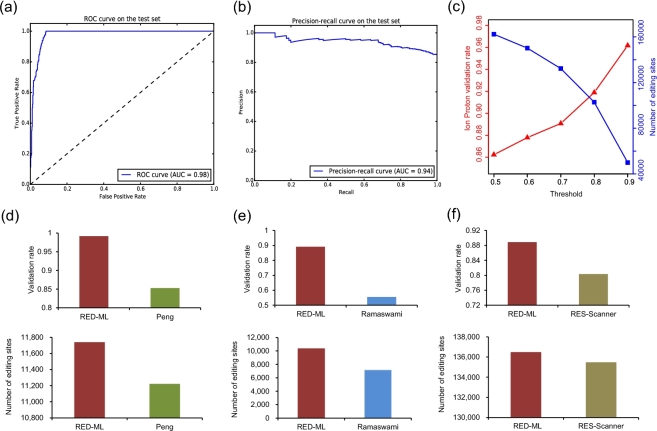
Figure 2:
Evaluating RED-ML on the YH dataset. (a and b) Receiver operating characteristic and precision-recall curves on the test set when building the LR classifier. Both curves were plotted to show a more comprehensive picture of RED-ML performance on this biased dataset, where the number of negative examples is about twice of the positive ones, and they are obtained by varying the detection threshold in small steps. (c) The effect of varying the detection threshold: the Ion Proton validation rate increases monotonically as more stringent classification thresholds are chosen. (d and f) Adjusting the detection threshold to compare RED-ML with the methods of Peng et al, Ramaswami et al. and RES-scanner: the thresholds used are 0.96, 0.5, and 0.68, respectively.

