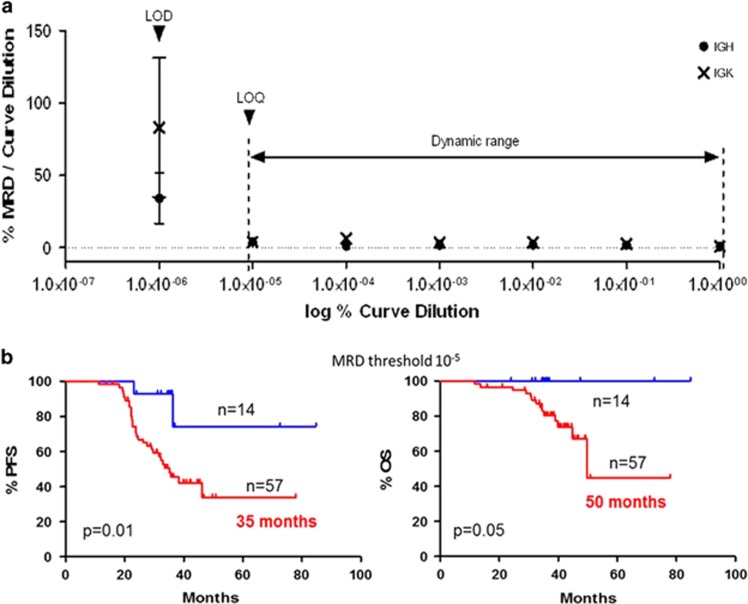
Figure 1.
Performance characteristics of the NGS assay. (a) Plot of the dynamic range, limit of quantification (LOQ) and limit of detection (LOD) of the method from a 10-fold dilution curve. The vertical axis represents the ratio of MRD values to curve dilution and the horizontal axis represents the logarithm value for curve dilution. R2 = 0.98 and 0.96 for IGH and IGK genes, respectively, P<0.0001. (b) Progression-free survival (PFS) and overall survival (OS) plots according to MRD levels. MRD-negative values (blue) and MRD-positive values (Red). The threshold for negative values was 10−5.

