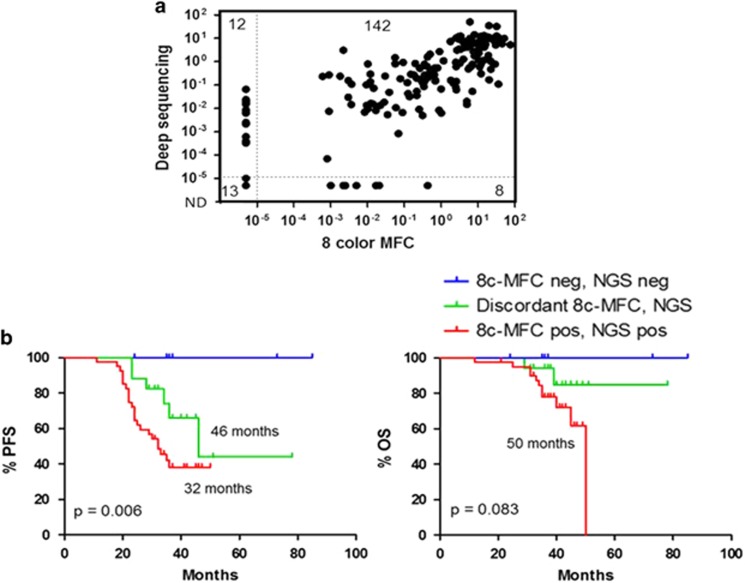
Figure 2.
Comparison between deep-sequencing (NGS) and multiparameter flow cytometry (8c-MFC) data. (a) Scatter plot showing correlation of MRD values between deep sequencing and eight-color MFC. Numbers on upper left and lower right indicates samples with discordant results. Spearman correlation coefficient R=0.7917, P<0.0001. (b) Progression-free survival (PFS) and overall survival (OS) plots of patients grouped according to concordance of MRD levels between NGS and 8c-MFC. Data corresponds to patients with MRD-negative values (MRD<10−5) by both methods (blue); MRD-positive values (MRD>10−5) by both methods (red); and MRD with discrepant data between NGS and 8c-FCM (green).

