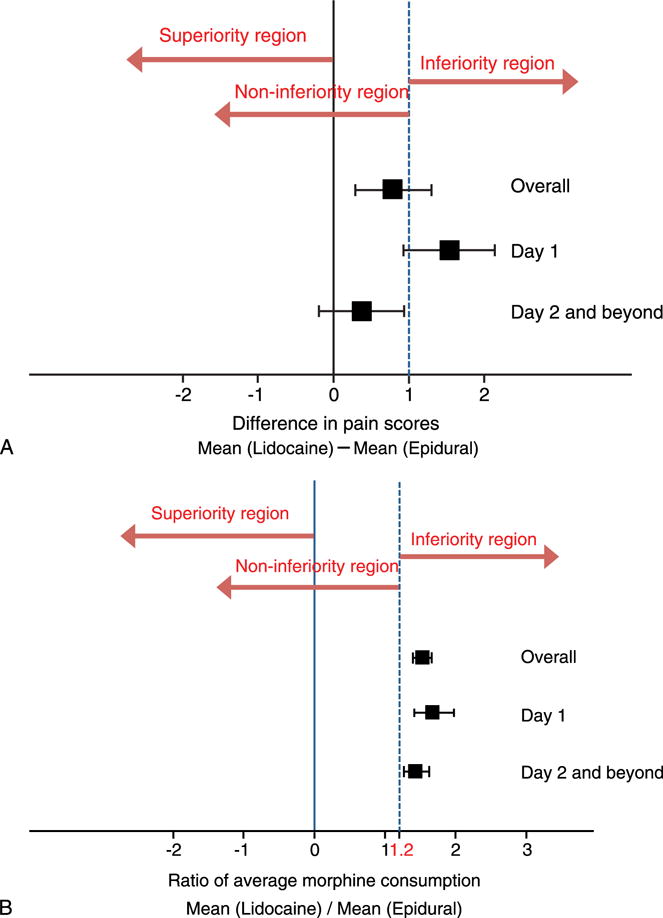
FIGURE 2.

Noninferiority margins. The squares represent the mean, whereas the whiskers represent the 95% CI. A, Pain score: overall and POD1 were inconclusive, even though the mean of POD1 is beyond the inferiority margin, the lower bound of the 95% CI falls within the noninferiority margin. However, day 2 and beyond was noninferior, as the upper bound of the 95% CI did not cross the inferiority margin. B, Morphine consumption (ratio): overall inferior, day 1 inferior, day 2 and beyond inferior.
