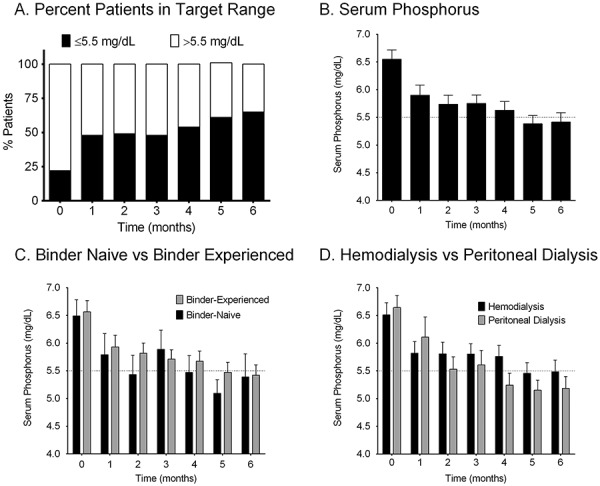
Figure 1. Serum phosphorus levels overall and by subgroup. Data presented are mean ± standard error of the mean (n = 92). A: Percent of patients within KDOQI target serum phosphorus range of ≤ 5.5 mg/dL (n = 92 at month 0 and n = 81 at month 6); B: Serum phosphorus levels over time for all patients (n = 92 at month 0 and n = 81 at month 6); C: Serum phosphorus levels for binder experience subgroups (binder-experienced subgroup: n = 71 at month 0 and n = 64 at month 6; binder-naïve subgroup n = 21 at month 0 and n = 17 at month 6); D: Serum phosphorus levels for dialysis subgroups (HD: n = 67 at month 0 and n = 62 at month 6; PD: n = 25 at month 0 and n = 19 at month 6).

