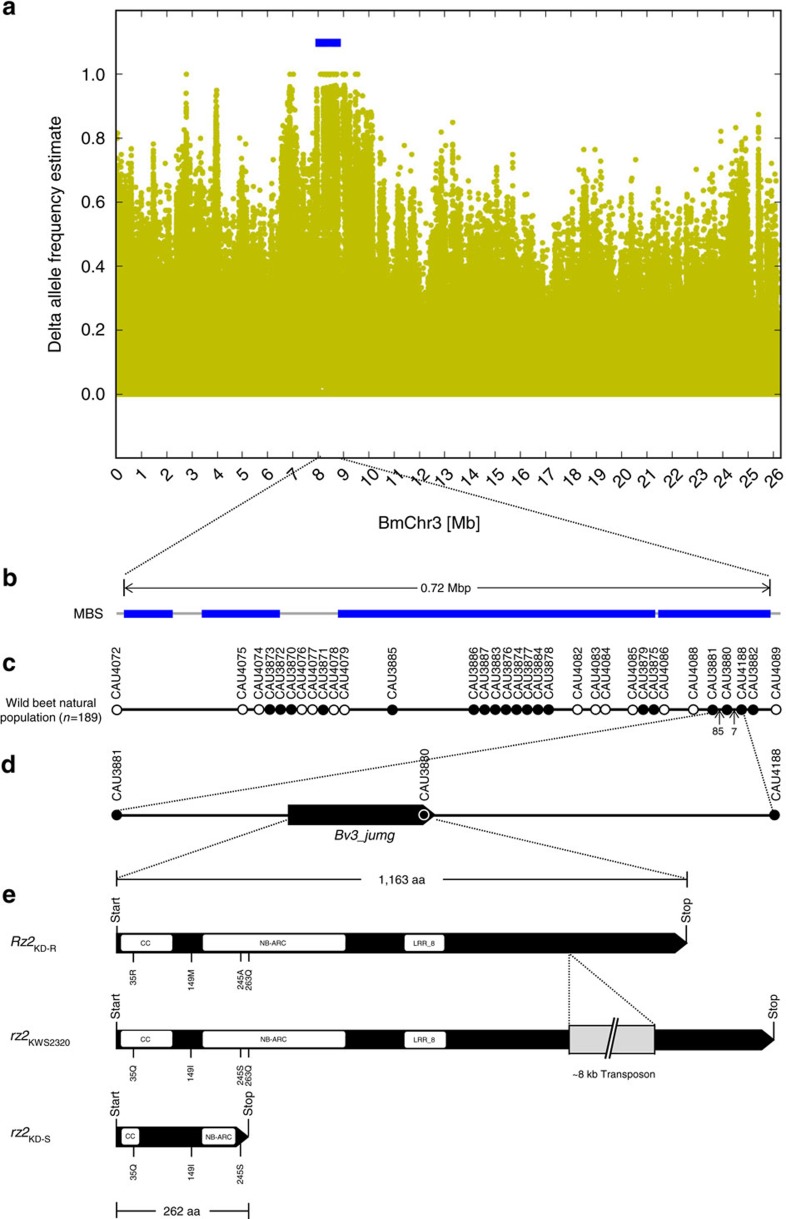
Figure 2. The Rz2 region identified by MBS.
(a) Plot of delta-AFe values for BmChr3. The delta-AFe values, indicated by yellow dots, clearly show a skew in the AFe values of the two pools created from four and eight plants unequivocally identified as homozygous resistant and susceptible, respectively. The blue bar indicates the target region defined by genetic intervals from MBS. (b) Sketch of the 0.72 Mbp target region. Blue bars indicate genetic intervals identified by MBS. (c) Association analysis results after testing 189 families of the Kalundborg population. Black and white circles represent markers associated and not associated with resistance, respectively. Arrows indicate the number of recombinant plants identified. (d) Location of Bv3_jumg identified as Rz2 by recombinant analysis. (e) Structure of the Rz2 gene. Rz2KD-R: allele identified in resistant plants in Kalundborg, rz2KWS2320: allele present in the susceptible sugar beet genotype KWS2320; rz2KD-S: allele identified in susceptible plants in Kalundborg. White box: location of conserved domains in the encoded protein sequence for three main domains of a CC-NB-LRR protein; grey box: transposon insertion location; number and letters: predicted amino acid changes.

