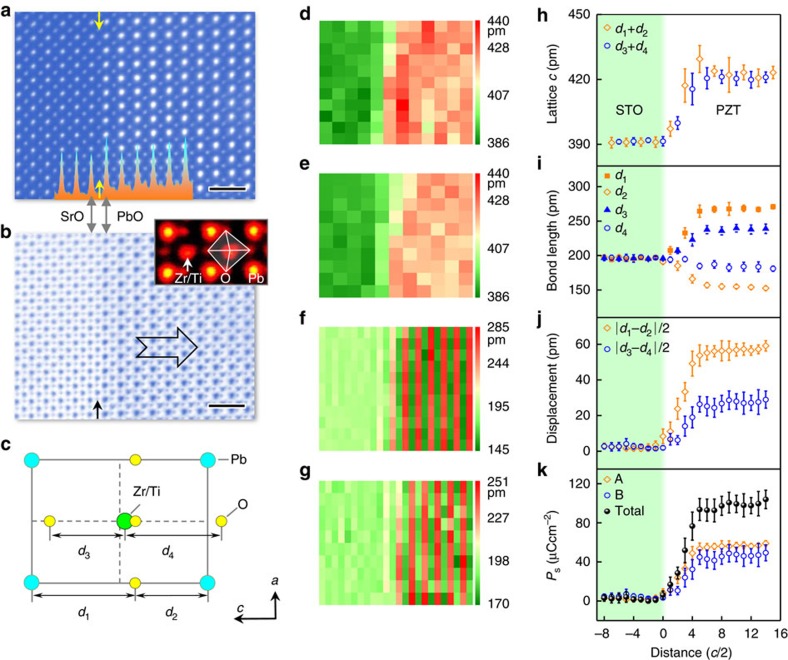
Figure 1. Quantitative measurements of polarization in PZT thin film on SrTiO3 substrate.
This region is 24-unit cells thick. (a) A high angle annular field image of a substrate–film interface. The arrow shows the position of interface, TiO2 plane, between the first SrO and PbO planes. Inset: the interface is determined by the intensity profile. Scale bar, 1 nm. (b) The simultaneous recorded ABF image of the interface. Inset: enlarged view of PZT. The contrast is inverted for clarity. The polarization is upward, that is, pointing to the surface as denoted by the big arrow. Scale bar, 1 nm. (c) Schematic shows the projection of tetragonal PZT seen along [010] direction. d1 and d2 denote the long and short distances between Pb atoms (cyan) and O atoms (yellow) along the c direction; d3 and d4 denote the short and long distances between Zr/Ti atoms (green) and O atoms (yellow) along the c direction. Both SrTiO3 (STO) and PZT are expressed as ABO3 structure, where A represents for Sr and Pb, and B represents for Ti or Zr/Ti. The lattice constants c is calculated from the (d) A sublattice, and (e) B sublattice. (f) The calculated bond lengths d1 and d2 in the AO plane. (g) The calculated bond lengths d3 and d4 in the BO2 plane. (h) Mean of lattice c. The error bar is the s.d. (i) Mean of bond lengths of d1, d2, d3 and d4. The error bar is the s.d. (j) Averaged displacements of |d1–d2|/2 and |d3–d4|/2. The error bar is the s.d. (k) Mean of polarization calculated from the displacements in PbO plane, TiO2 plane and the total. The error bar is the s.d.

