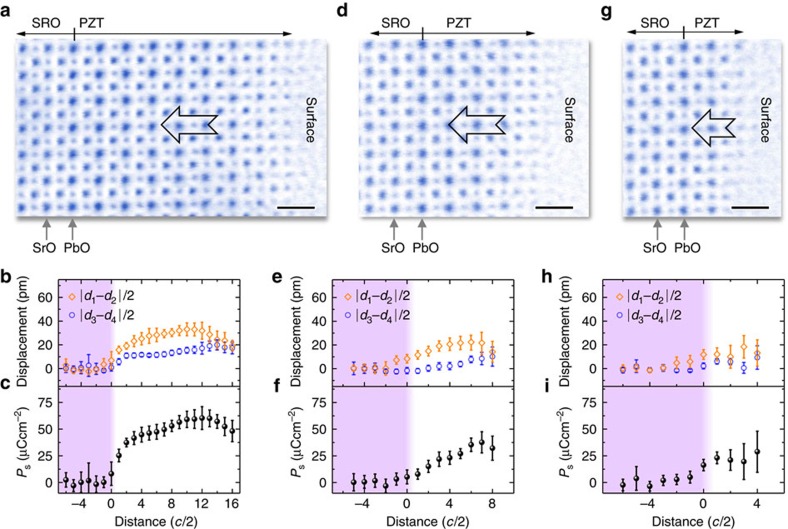
Figure 3. Thickness-dependent atomic displacements in PZT/SrRuO3/SrTiO3.
(a) An ABF image from a region with thickness of 8-unit cells. Scale bar, 0.5 nm. (b) Mean of displacements are calculated from of |d1–d2|/2 and |d3–d4|/2. The error bar is the s.d. (c) Mean of polarization calculated from the displacements. The error bar is the s.d. (d) An ABF image from a region with thickness of 4-unit cells. Scale bar, 0.5 nm. (e) Mean of displacements are calculated from of |d1–d2|/2 and |d3–d4|/2. The error bar is the s.d. (f) Mean of polarization calculated from the displacements. The error bar is the s.d. (g) An ABF image from a region with thickness of 2-unit cells. Scale bar, 0.5 nm. (h) Mean of displacements are calculated from of |d1–d2|/2 and |d3–d4|/2. The error bar is the s.d. (i) Mean of polarization calculated from the displacements. The error bar is the s.d.

