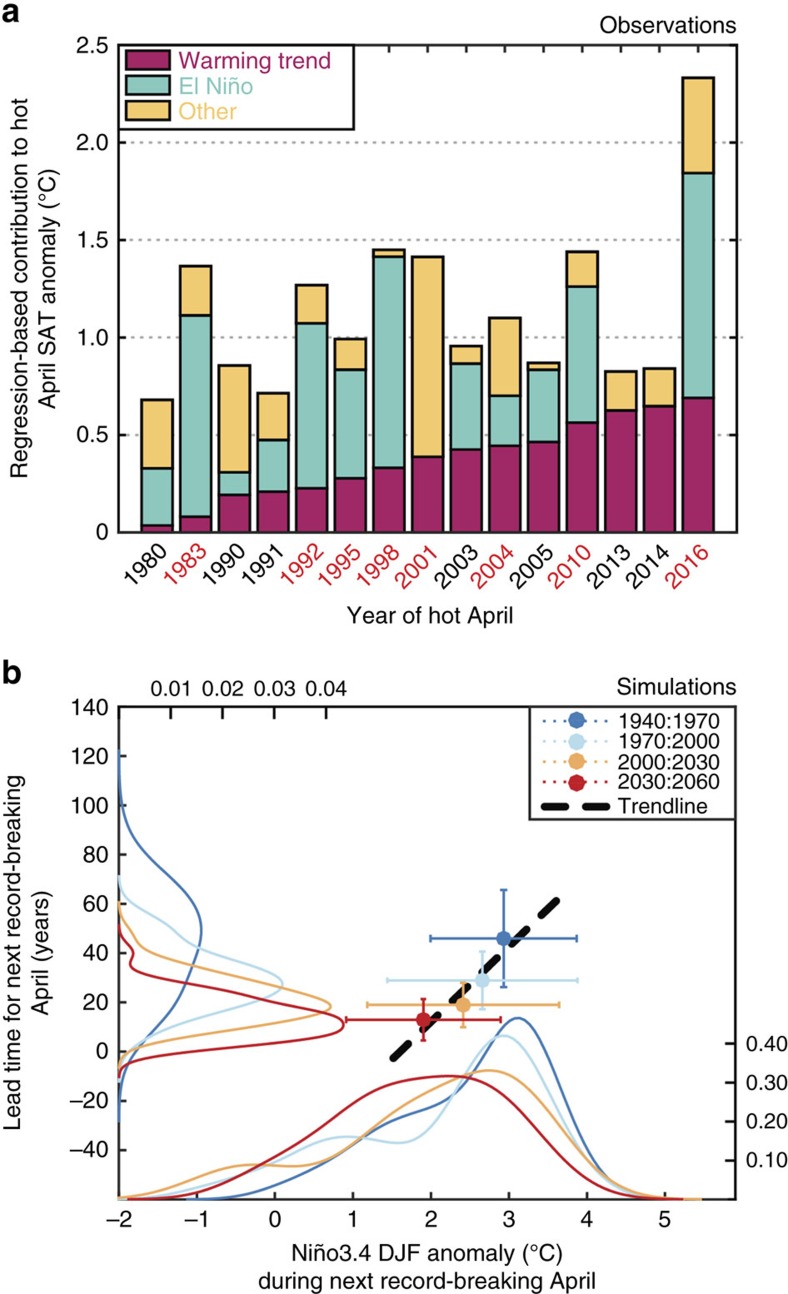
Figure 4. Attributing hot Aprils in Mainland Southeast Asia.
(a) Observations: The relative contribution of El Niño (green bars) versus the long-term warming trend (red bars) towards the 15 hottest April SATs (>80th percentile) in the GISTEMP record of Mainland Southeast Asia (MSA; 1940–2016) using a regression model. The residual of the observed anomaly and the regression fit is termed as ‘other' variability (yellow bars). The years in red on the x-axis indicate the eight hottest extreme April events (>90th percentile). (b) Simulations: Median lead time for the next record-breaking April (years) compared to the baseline period (colours in legend) versus the median DJF Niño-3.4 SST anomaly (°C) for that forthcoming record-breaking year across all CESM1-LE members (with ±1σ ranges across the 39 members at each baseline period). A trendline for these datapoints calculated with the uncertainty is shown (black dashed line). Also depicted are the estimated probability density functions from the histograms of lead times as well as the DJF Niño-3.4 SST anomalies during the next record-breaking April at each baseline period.

