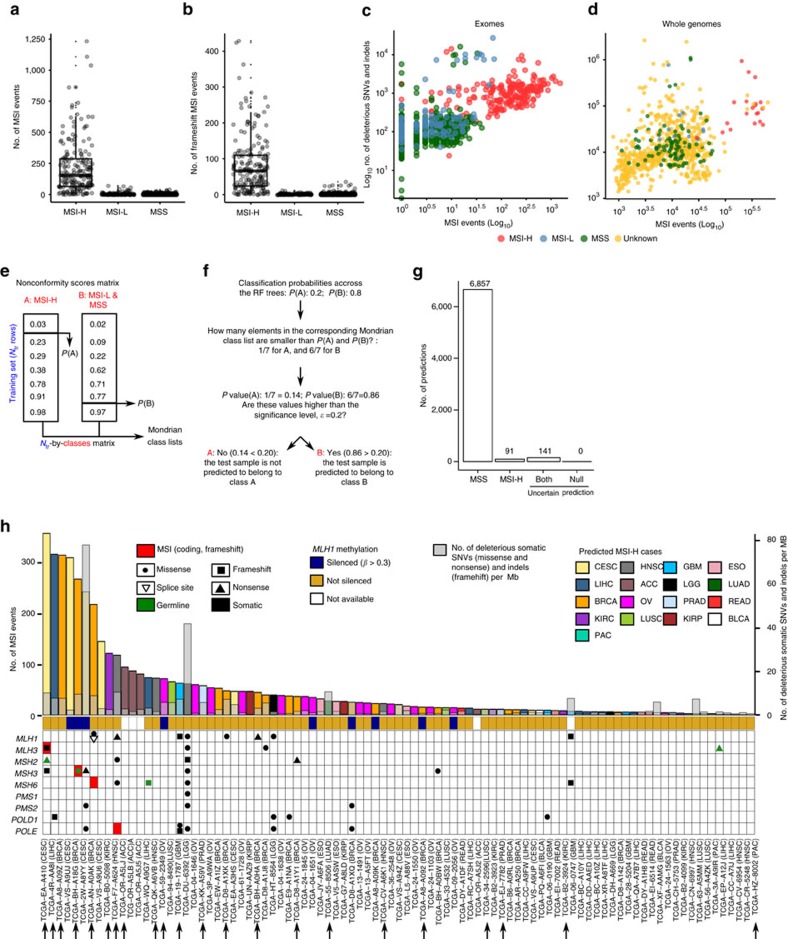
Figure 5. Distribution of the number of MSI and prediction of MSI status.
Distribution of the number of MSI (a) and frameshift MSI events (b) in MSI-H and MSS (also including MSI-L) tumours. Correlation between the number of SNV and MSI events in exomes (c) and whole genomes (d). Prediction of MSI status from exome-sequencing data using conformal prediction and random forest models (e). Initially, we used 10-fold cross-validation to calculate predictions for all training examples. The fraction of trees in the forest voting for each class was recorded, and subsequently sorted in increasing order to define one Mondrian class list per category. (f) The model which was trained on all training data was applied to 7,089 exomes. For each of these samples, the algorithm recorded the fraction of trees voting for each class. The P value for each class was calculated as the number of elements in the corresponding Mondrian class list higher than the vote for that class (for example, 6 out of 7 in the toy example depicted in Fig. 5f) divided by the number of elements in that list. If the P value for a given class is above the significance, ɛ, the sample is predicted to belong to that category. The confidence level (1−ɛ) indicates the minimum fraction of predictions that are correct. (g) Number of samples predicted as MSI-H, MSS and uncertain (both: cases in which the classifier does not have enough power to confidently assign a single category; none: cases in which when the samples that are outside the applicability domain of the model). Here, the confidence level was set to 0.75. (h) Landscape of MSI for the 91 exomes predicted as MSI-H at a confidence level of 0.75. Samples predicted to be MSI-H at a confidence level of 0.80 are marked with black arrows.

