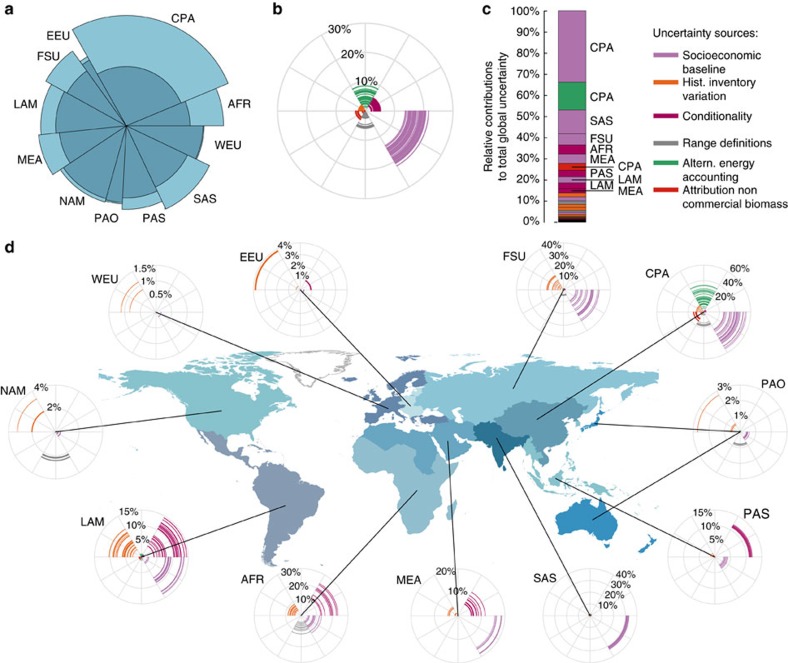
Figure 3. Regional contributions of uncertainty sources to overall NDC emission projection uncertainty.
(a) Regional emissions contributions to global emissions and uncertainty under the full implementation of current NDCs. Shadings show the minimum–maximum range of emissions estimates per region; (b) Estimates of the magnitude of uncertainty induced in 2030 per source relative to the median estimate; (c) Average contribution to full uncertainty range in 2030 per uncertainty source with the 10 most important contributions identified by region; (d) As b but per geographical region. AFR, Sub-Saharan Africa; CPA, Centrally Planned Asia and China; EEU, Central and Eastern Europe; FSU, Former Soviet Union; LAM, Latin America and the Caribbean; MEA, Middle East and North Africa; NAM, North America; PAS, Pacific OECD; SAS, South Asia; PAS, Other Pacific Asia; WEU, Western Europe. Country borders use the simplified TM World borders, provided by Bjorn Sandvik (thematicmapping.org).

