
Figure 3. Viral evolution after 10-1074 infusion in HIV-1-infected participants.
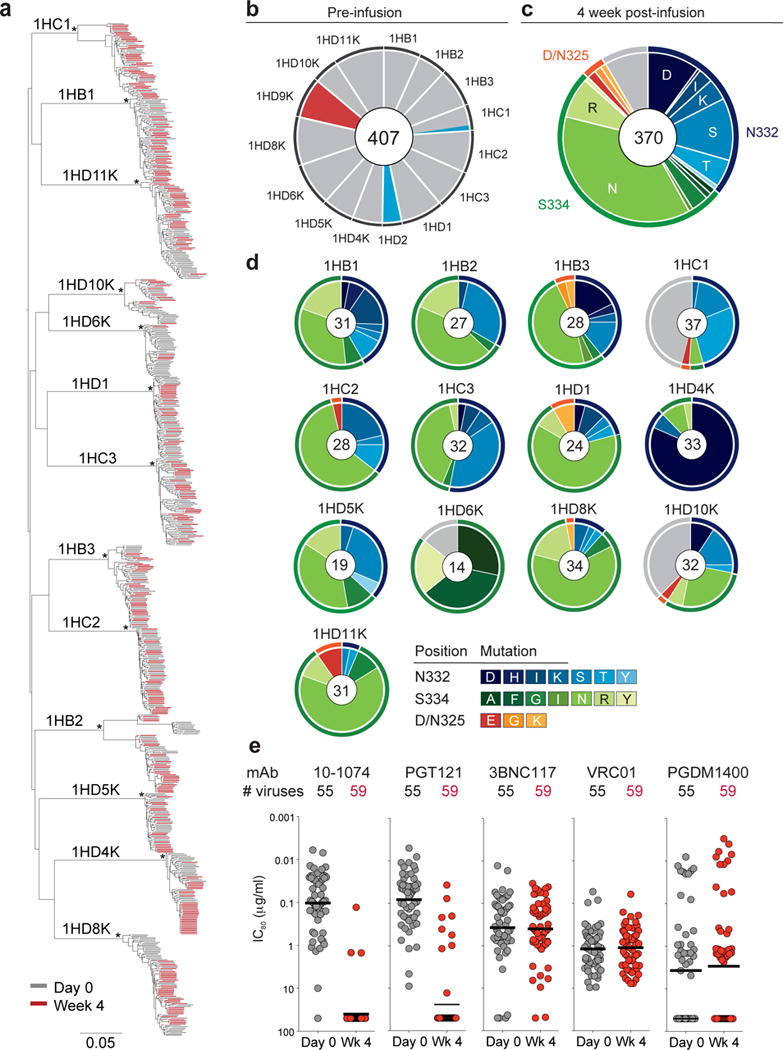
(a) Maximum-likelihood phylogenetic tree of single genome-derived env gene sequences obtained from plasma before (day 0, grey) and 4 weeks after 10-1074 infusion (Week 4, red). Asterisks indicate nodes with bootstrap support of 100% (100 replicates). (b) Pie chart showing the frequency of resistance mutations found in circulating viruses by SGS before infusion for each subject. Grey indicates absence of potential resistance mutation at positions 325, 332 and 334. Colors correspond to mutations indicated in (c). For all pie charts the number of analyzed sequences is shown in the center. (c) Pie chart showing amino acid frequencies at three recurrently mutated 10-1074 contact sites for all pooled circulating virus sequences obtained by SGS 4 weeks after infusion. Outer rings indicate position of mutation (orange, 325; blue, 332; green, 334; grey, unmutated). (d) As in (c) but for each individual. Colors indicate the type of mutation. For 1HD6K and 1HD10K both week 4 and week 8 were included in (c) and (d). (e) Graph showing sensitivity to the indicated anti-HIV-1 antibodies of 114 different viral isolates obtained from 11 individuals before (grey, 55 isolates) and 4 weeks after 10-1074 infusion (red, 59 isolates) with IC80 values (μg/ml) on the y-axis (log10 scale). Each dot represents one viral isolate. Lines indicate geometric mean. Samples were run in duplicate.