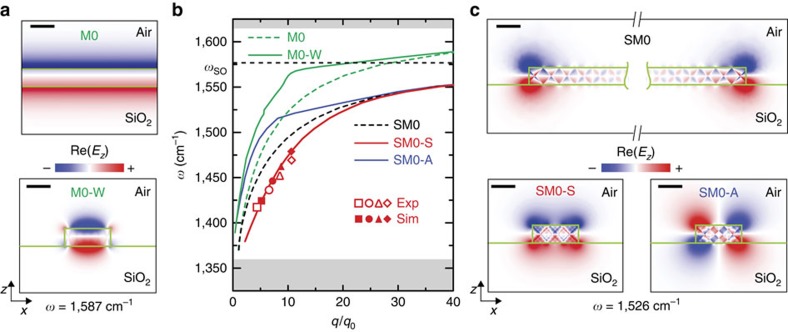
Figure 3. Dispersion and near-field distribution of hyperbolic phonon–polaritons in h-BN.
(a) Near-field distribution of volume modes of a slab (M0), and of a rectangular waveguide (M0-W). (b) Dispersion curves of volume modes (green solid and dashed lines) and surface modes (black dashed line (SM0), and red and blue solid lines (SM0-S and SM0-A)). The experimental (open symbols) and calculated (solid symbols) data points (qn, ωn) were extracted from Fig. 2d,e, respectively. The different symbols represent the data obtained from the different resonance orders n. The horizontal axis is normalized to the momentum of light in free space, q0. The white area marks the reststrahlen band. The horizontal black dashed line indicates the asymptote for surface modes (ωSO). (c) Near-field distribution of the fundamental surface mode of a semi-infinite slab (SM0), the symmetric surface mode (SM0-S) and the antisymmetric surface mode (SM0-A) of a rectangular waveguide. The width and height of the rectangular waveguide are 190 nm and 74 nm, respectively. The height of the slab is 74 nm. Scale bars, 100 nm (a,c).

