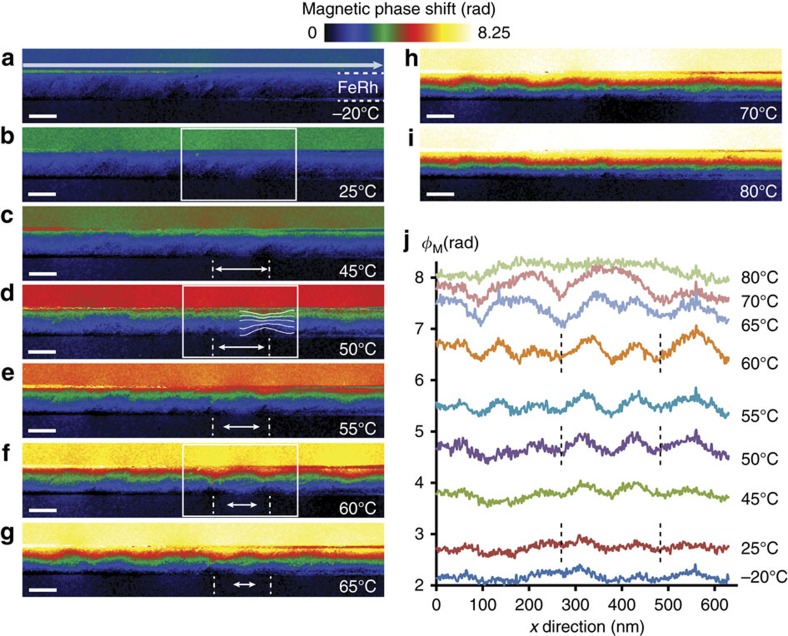
Figure 5. Main stages of the transition while increasing temperature.
(a–i) Magnetic phase images. The colour scale is common to all images and scale bars represent 50 nm. On the phase image recorded at 50 °C (d) are displayed the isophase lines parallel to the induction lines: the narrowing corresponds to a local increase of the phase variation and the appearance of ferromagnetic domains. The two dotted lines into the MgO part are centred on two ferromagnetic domains and the double arrow between them corresponds to the approximate width of the enclosed antiferromagnetic domain. The areas enclosed by the white rectangles for phase images at 25 °C (b), 50 °C (d) and 60 °C (f) are used for micromagnetic simulations presented Fig. 6. (j) Phase profiles extracted for different temperatures along the upper interface (large arrow on the magnetic phase image obtained at −20 °C).

