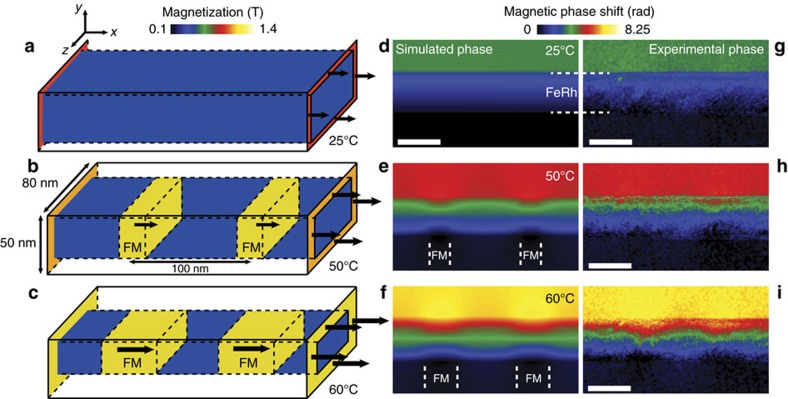
Figure 6. Micromagnetic simulations and comparison with experimental phase images.
(a–c) 3D schemes used for the micromagnetic simulations of the area enclosed by the white rectangle in Fig. 5b,d,f (25, 50 and 60 °C respectively). The ferromagnetic damaged surfaces are not represented for clarity. (d–i) Comparison between simulated magnetic phase images calculated from micromagnetic simulations and (h–j) experimental magnetic phase images obtained at same temperatures. Scale bars represent 50 nm.

