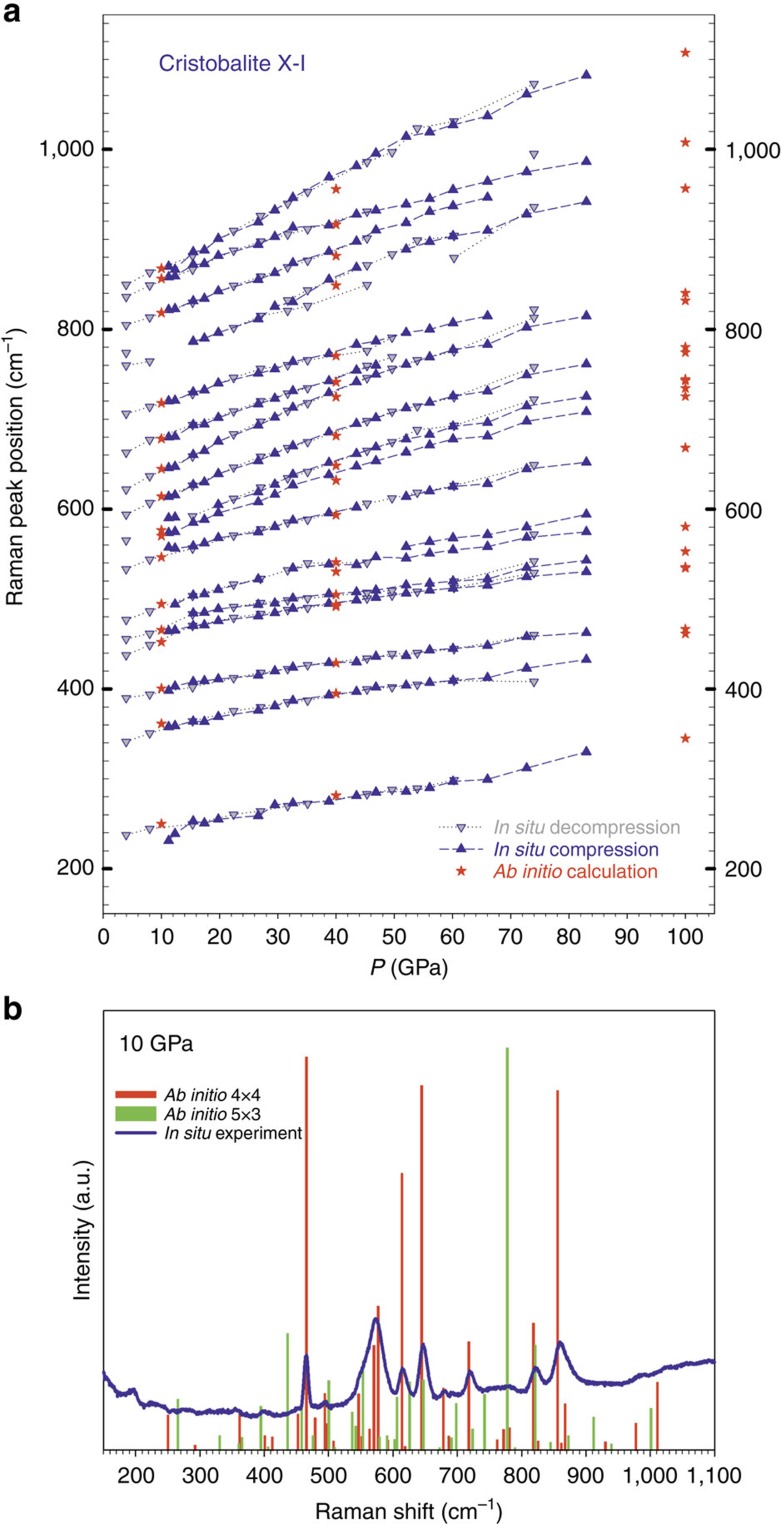
Figure 3. Pressure Raman spectra of cristobalite X-I.
(a) Pressure dependence of the Raman modes in cristobalite X-I at ambient temperature obtained experimentally (blue triangles ‘up' for compression and ‘down' for decompression) and simulated by ab initio calculations for the 4 × 4 arrangement (red stars). The lines are guides for enhanced readability. (b) Comparison of the Raman experimental spectrum (blue continuous line) and theoretical spectra for the 4 × 4 (red vertical bars) and 5 × 3 (green vertical bars) arrangements at 10 GPa.

