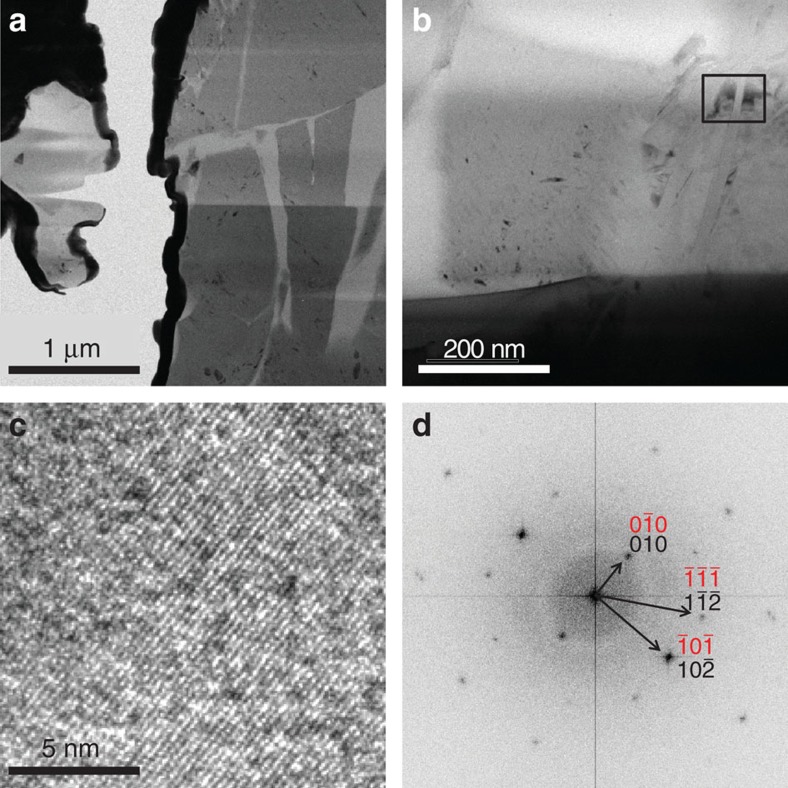
Figure 7. TEM analyses of the recovered samples.
Powder sample recovered from an experiment where starting α-cristobalite was cold-pressed to ca. 50 GPa and quenched to ambient conditions. (a,b) Bright field image showing isolated crystalline grains (dark grey) surrounded by amorphous matrix (light grey), with the rectangle in b marking the area selected for the HRTEM image shown in c. FFT (Fast Fourier Transform) diffraction pattern (d) derived from the area presented in c. The d-spacings obtained by FFT can be indexed as both α-cristobalite (black) and seifertite (red) in this particular direction. Due to high beam sensitivity, only one orientation of the specimen was acquired. The pattern seems to be more suitably indexed as α-cristobalite.

