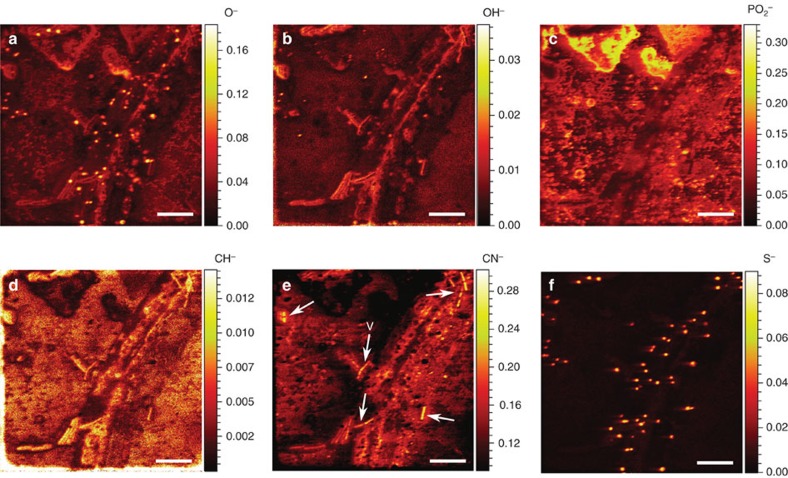
Figure 3. ToF–SIMS reveals sample composition via yield of secondary ion species.
Mass-resolved chemical map of P. ultimum hyphae as well as vegetative cells and spores of B. subtilis on top of the silicon wafer. Six negative secondary ion species were detected (a–f) in a 56 × 56 μm sample area. ToF–SIMS images produced were normalized by the total ion counts. The colour scale indicates the relative ion counts for each secondary ion species with warmer colours representing higher relative ion counts and cooler colours representing lower relative ion counts. Arrows in e point to vegetative cells (V). Scale bars, 10 μm.

