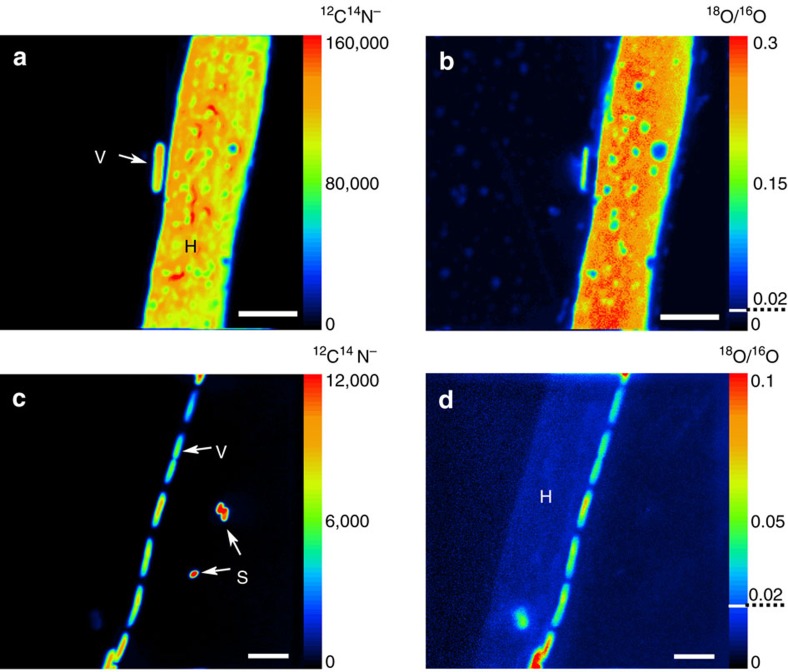
Figure 4. Water is transferred from hyphae to bacterial cells in dependence of the spatial organization.
NanoSIMS images of P. ultimum hyphae (H), B. subtilis spores (S) and vegetative cells (V) identified in the total biomass (12C14N−) images (a,c) of 18O-enriched samples. The ratio images of 18O/16O show the incorporation of label from water from the nutrient-rich zones into the biomass of P. ultimum and B. subtilis (b,d). The colour scale indicates the intensities of 12C14N− (a,c) and enrichment in 18O (b,d) with warmer colours representing higher secondary ion counts (a,c) or enrichment (b,d) levels and cooler colours representing lower values. Dashed lines indicate natural abundance of 18O. Images represent different fields of analysis corresponding to sample areas of 20 × 20 (a,b) and 30 × 30 μm (c,d). Scale bars, 4 μm.

