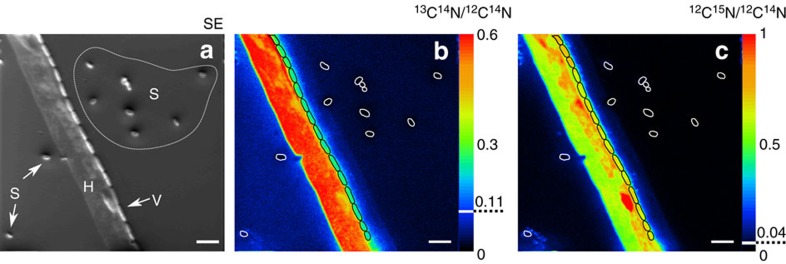
Figure 5. Bacterial cells in close proximity to the hyphae receive carbon and nitrogen.
NanoSIMS images of P. ultimum hyphae (H), B. subtilis spores (S) and vegetative cells (V) identified in the secondary electron (SE) image (a) of 13C and 15N -enriched samples. The ratio images of 13C14N/12C14N (b) and 12C15N/12C14N (c) show the incorporation of label into the biomass of P. ultimum and B. subtilis. The colour scale indicates the relative enrichment in 13C and 15N (b,c) with warmer colours representing higher enrichment levels and cooler colours indicating lower values. The higher background signal for 13C on the left side of the hyphae (b) results from the topography-dependent re-deposition of sputtered sample material. Dashed lines indicate natural abundances of 13C and 15N. Vegetative cells and spores are framed in black and white, respectively. Images represent a field of analysis corresponding to a sample area of 40 × 40 μm. Scale bars, 4 μm.

