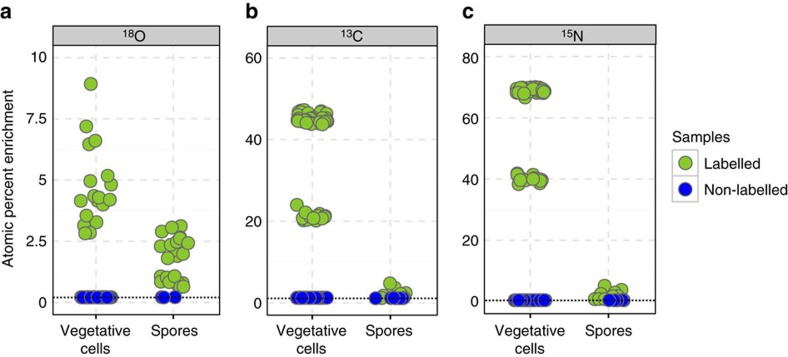
Figure 6. Vegetative cells are higher enriched in 13C, 15N and 18O compared with spores of B. subtilis.
Atom percent enrichment (APE) for (a) 18O, (b) 13C and (c) 15N by single cells and spores of B. subtilis measured with nanoSIMS in labelled (green) and non-labelled (blue) samples. Data are derived from different fields of analysis and from replicate wafers (for details see Supplementary Table 1). Dashed lines represent literature values for the stable isotope natural abundance.

