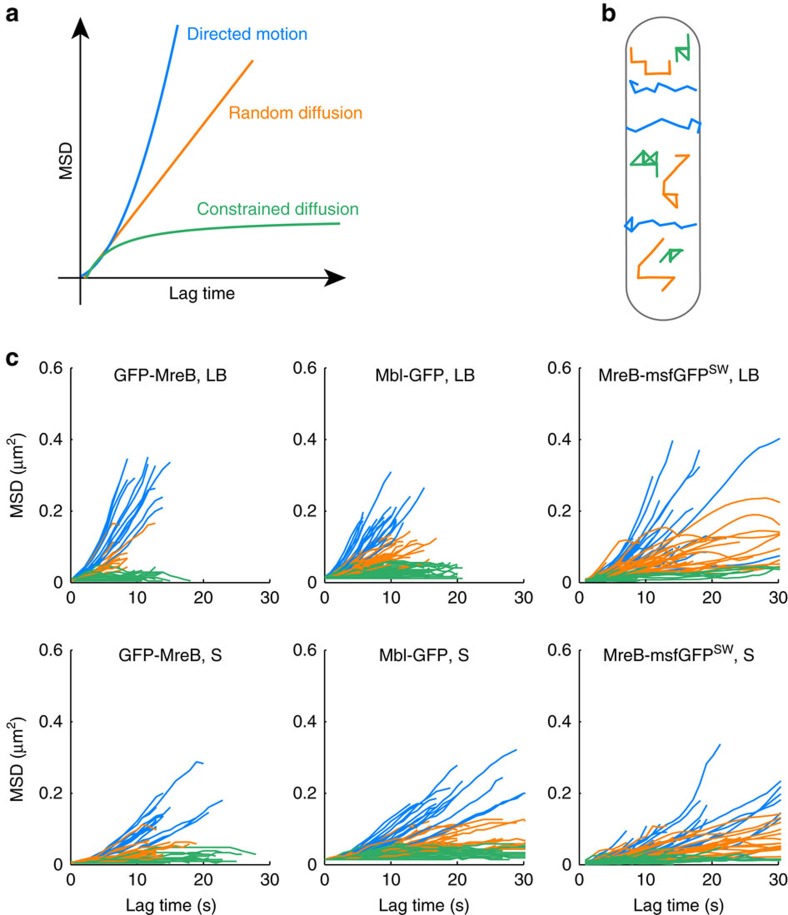
Figure 2. Heterogeneity of modes of movement of MreB patches at the single-cell level.
(a,b) Idealized representation of the three categories of MreB patch motion. (a) MSD curves allow classification of the mode of movement: (i) second-order polynomial fit indicates directed motion (blue): MSD(t)=(νt)2, where ν is speed and t is time; (ii) a linear plot indicates random diffusion (orange): MSD(t)=4Dt, where D is the diffusion constant; (iii) when the MSD curve reaches a plateau, the system is undergoing constrained diffusion (green). (b) Representation of 2D-SPT trajectories (following the above-mentioned colour code) exhibiting the three modes of MreB patch motion in a rod-shaped cell. (c) Dynamics of MreB patches in individual cells growing at different growth rates. Samples of MSD curves of representative B. subtilis cells carrying native GFP-MreB (left) and Mbl-GFP (middle) fusions, and of E. coli cells carrying the MreB-msfGFPSW fusion (right) grown in LB and S media at 37 °C. Blue, directed motion; orange, random diffusion; green, constrained diffusion.

