
Fig. 3.
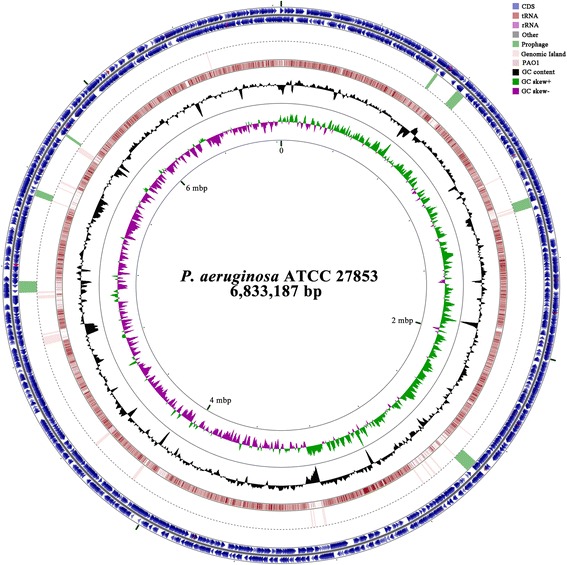
Circular genome map of P. aeruginosa ATCC 27853 showing the Genomic Islands (GIs) predicted by IslandViewer and prophages. From the outside: circles 1 and 2 (clockwise and counterclockwise) genes on the + and - strands, respectively; circles 3, prophages; 4, Genomic Islands; 5, PAO1 genes; 6, GC content; 7, GC skew. The scale in mbp is indicated on the innermost of the map