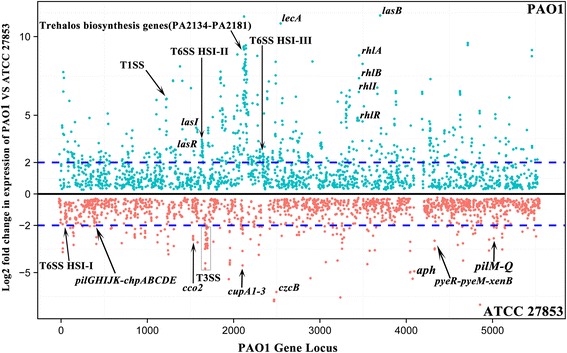
Fig. 7.

The genome wide transcriptomic profile of P. aeruginosa ATCC 27853 and PAO1. Green dots represent genes with higher relative expression level in PAO1 and red dots indicate genes with higher relative expression levels in ATCC 27853. The blue dashed lines represent log2-fold changes in expression. Selective genes and operons with distinctive expression patterns in the two strains are indicated
