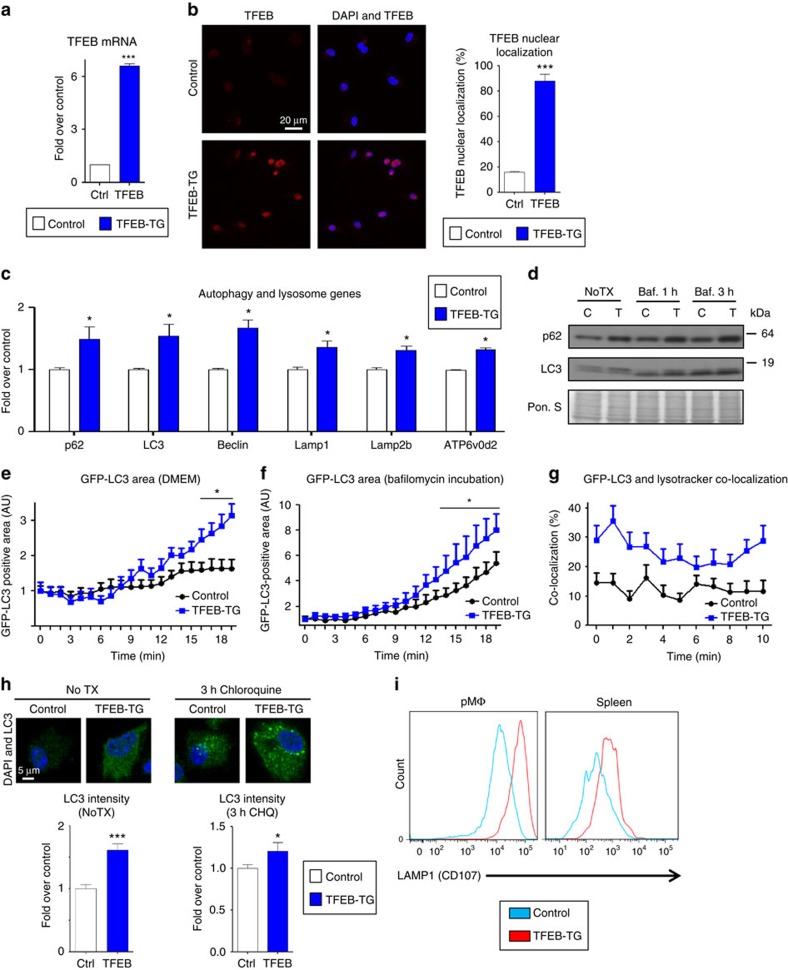
Figure 2. TFEB overexpression induces autophagy and autophagy–lysosomal biogenesis in macrophages.
(a–c) Control and TFEB-overexpressing (TFEB-TG) thioglycollate-elicited peritoneal macrophages (hereafter referred to as macrophages) were assessed as follows: transcript levels of (a) TFEB and (c) several autophagy–lysosome markers were evaluated by quantitative polymerase chain reaction (qPCR, n≥3 independent wells). (b) TFEB nuclear localization was assessed by immunofluorescence staining and quantified as percentage of TFEB-positive nuclei (n≥40 cells per group, scale bar, 20 μm). (d) Western blot analysis of p62 and LC3 in TFEB-TG macrophages after bafilomycin (200 nM) treatment for indicated times (C, control; T, TFEB-TG). (e–g) Control and TFEB-TG macrophages also co-expressing GFP-LC3 were evaluated by live imaging (every 30 s for the indicated times) while being incubated with either (e) DMEM, (f) bafilomycin (200 nM) or after staining with (g) Lysotracker-red. Graphs represent (e,f) GFP-LC3-positive areas or (g) per cent of GFP-LC3 co-localized with Lysotracker-red over the indicated times. For e,f each time point is compared with the control GFP-LC3 group (n≥10 cells for each treatment). (h) LC3 levels and the intracellular pattern were analysed by immunofluorescence staining of baseline (NoTX) or after 3 h of 10 μM chloroquine incubation. Graphs represent the mean LC3 intensity (n=16–46 cells, scale bar, 5 μm). (i) FACS analysis of peritoneal and splenic macrophages from control or macrophage-specific TFEB-TG mice for LAMP1 expression. For all graphs, three independent experiments were performed; data presented as mean±s.e.m. *P<0.05, ***P<0.001, two-tailed unpaired t-test. Baf,bafilomycin; CHQ, chloroquine; Ctrl, control; DAPI, 4,6-diamidino-2-phenylindole.

