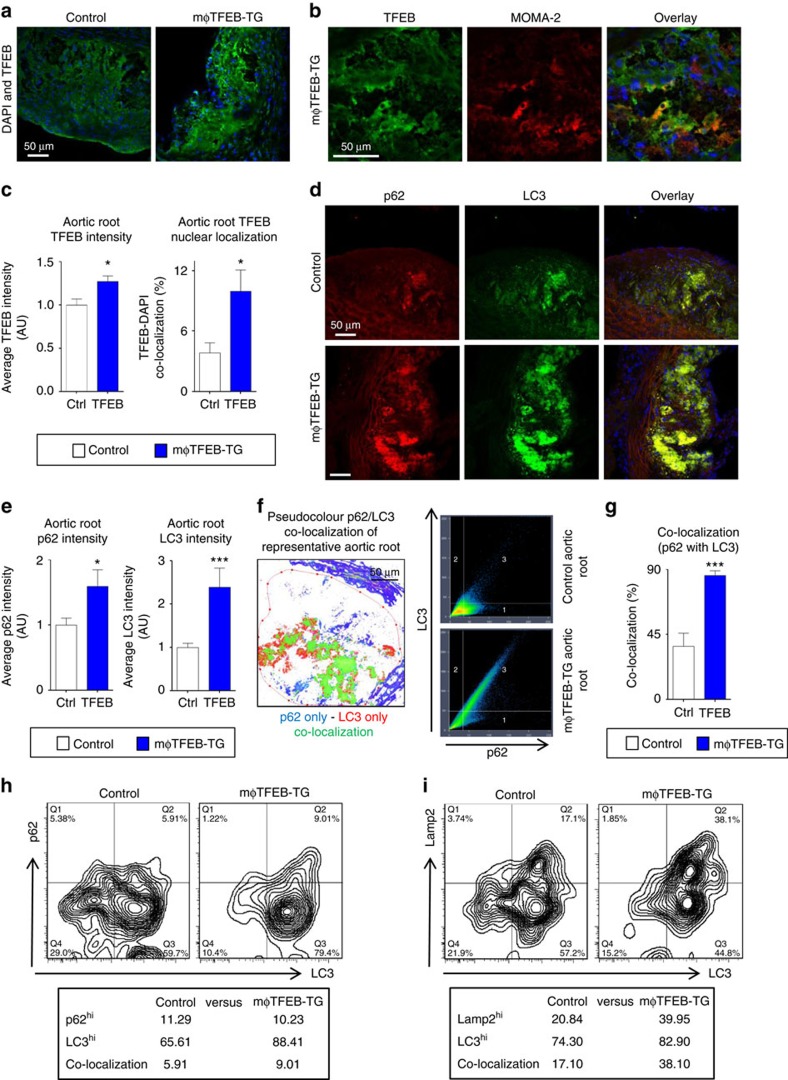
Figure 3. TFEB overexpression in macrophages induces the autophagy markers LC3 and p62 and restores their co-localization in atherosclerotic aortic roots.
(a,b) Representative immunofluorescence images of atherosclerotic aortic roots (2 months' western diet) from control and mφTFEB-TG mice (ApoE-null background) stained with antibodies against TFEB (a), TFEB and MOMA-2 (b; scale bar, 50 μm). (c) Quantification of the average TFEB intensity and co-localization with nuclear marker DAPI (n=4-5 mice per group). (d) Representative immunofluorescence images of atherosclerotic aortic roots from control and mφTFEB-TG mice stained with p62 and LC3 (scale bar, 50 μm). (e) Quantification of the p62 and LC3 average intensity from control and mφTFEB-TG-stained roots (n=13–14 mice per group). (f) Representative pseudocolour image of these p62/LC3 images (green represents co-localization) and graph depicting the increased p62/LC3 correlation seen in a representative mφTFEB-TG as compared to a control lesion (scale bar, 50 μm). (g) Quantification of the p62/LC3 co-localization from control and mφTFEB-TG-stained roots shown (n=13–14 mice per group). (h,i) FACS analysis of aortic macrophages isolated from atherosclerotic aortas of Control or mφTFEB-TG mice (western diet-fed ApoE-KO background, n=3–4 pooled aortas) and stained for either (h) p62 and LC3, or (i) Lamp2 and LC3 antibodies (per cent of macrophages expressing each marker is shown below plots). For all graphs, data are presented as mean±s.e.m. *P<0.05, ***P<0.001, two-tailed unpaired t-test.

