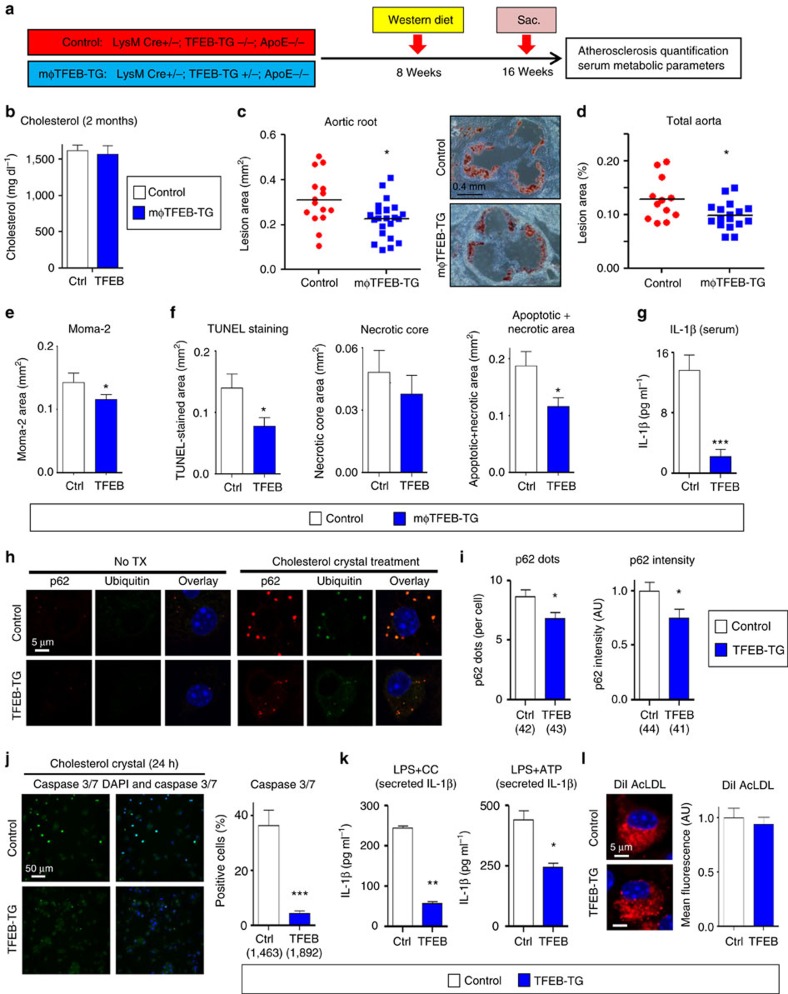
Figure 4. Macrophage-specific TFEB overexpression is atheroprotective.
(a) Experimental protocol and mouse cohorts used for assessment of atherosclerosis. (b–g) Control and mφTFEB-TG mice (all on ApoE-KO background) were fed a western diet for 2 months for lesion development. (b) Serum cholesterol levels at 2 months (n≥14 mice per group). (c) Quantification of atherosclerotic plaque burden using Oil Red O-stained aortic root sections with representative roots shown on right (scale bar, 0.4 mm) and (d) en face analysis of whole aorta (statistical significance of differences calculated using Mann–Whitney U-test). (e) Macrophage content in aortic root sections was analysed by MOMA-2-positive area (n≥12 mice per group). (f) Apoptotic, necrotic core and combined apoptotic–necrotic core areas of aortic root sections were determined by quantifying TUNEL immunofluorescence staining, acellular areas or the combined area, respectively (n≥12 mice per group). (g) Serum IL-1β concentration was measured from n≥6 independent samples derived by pooling serum from two to three mice per sample (>12 mice per group). (h) Control and TFEB-TG macrophages treated with or without cholesterol crystals for 24 h and stained using DAPI (nuclei) and antibodies against polyubiquitinated proteins (FK-1) and p62 (scale bar, 5 μm). (i) Quantification of average p62/ubiquitin-positive dots and average p62 intensity per cell from immunofluorescence experiment described in h (numbers of cells under each bar). (j) Control and TFEB-TG macrophages were incubated with cholesterol crystals and per cent of caspase 3/7-positive cells quantified in three independent experiments. Representative immunofluorescence images are shown on left and numbers of cells shown under each bar (scale bar, 50 μm). (k) Control and TFEB-TG macrophages were treated with LPS (lipopolysaccharide)+cholesterol crystals (hereafter referred to as LPS+CC) for 24 h or with LPS followed by ATP for 3 h. Culture media were assayed for IL-1β by ELISA (n=3 independent wells for each treatment). (l) Control and TFEB-TG macrophages were treated with DiI-acetylated LDL for 12 h and intracellular lipid accumulation quantified by immunofluorescence microscopy (n≥187 cell per group, scale bar, 5 μm). For all graphs, data are presented as mean±s.e.m. *P<0.05, **P<0.01, ***P<0.001, two-tailed unpaired t-test, except c,d.

