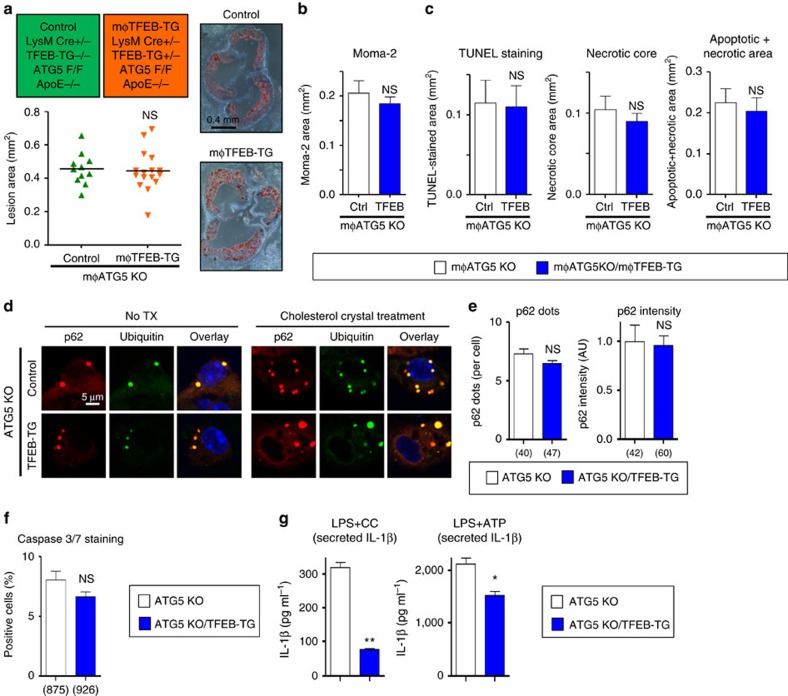
Figure 5. Macrophage-specific TFEB overexpression requires an intact autophagy pathway for atheroprotection including efficient clearance of polyubiquitinated protein aggregates and reductions in macrophage apoptosis.
(a) Cohorts of control and mφTFEB-TG mice (all on mφATG5-KO and ApoE-KO background) were fed a western diet for 2 months to develop lesions—exact genotypes are provided at the top of the graph. Atherosclerotic plaque burden was quantified by computer image analysis of Oil Red O-stained aortic root sections with representative Oil Red O-stained aortic roots shown on right (scale bar, 0.4 mm; statistical significance of differences was calculated using Mann–Whitney U-test). (b) Macrophage content in aortic root sections was analysed by immunofluorescence staining using an antibody against MOMA-2 (n≥10 mice per group). (c) Apoptotic, necrotic core and combined apoptotic–necrotic core areas of aortic root sections were determined by quantification of TUNEL immunofluorescence staining, acellular areas or a combination of the two, respectively (n≥10 mice per group). (d) Immunofluorescence images of ATG5-KO and ATG5-KO/TFEB-TG macrophages treated with or without cholesterol crystals for 24 h and stained using DAPI (nuclei) and antibodies against polyubiquitinated proteins (FK-1) and p62 (scale bar, 5 μm). (e) Quantification of average p62/ubiquitin-positive dots and average p62 intensity per cell from immunofluorescence experiment described in d (numbers of quantified cells are shown under each bar). (f) ATG5-KO and ATG5-KO/TFEB-TG macrophages were incubated with cholesterol crystals and the per cent of caspase 3/7-positive cells was quantified in three independent experiments (numbers of quantified cells are shown under each bar). (g) ATG5-KO and ATG5-KO/TFEB-TG macrophages were treated with LPS+CC for 24 h or with LPS, followed by ATP for 3 h. Culture media were assayed for IL-1β by ELISA (n=3 independent wells for each treatment). For all graphs, data are presented as mean±s.e.m. *P<0.05, **P<0.01, NS: not significant, two-tailed unpaired t-test, except a.

