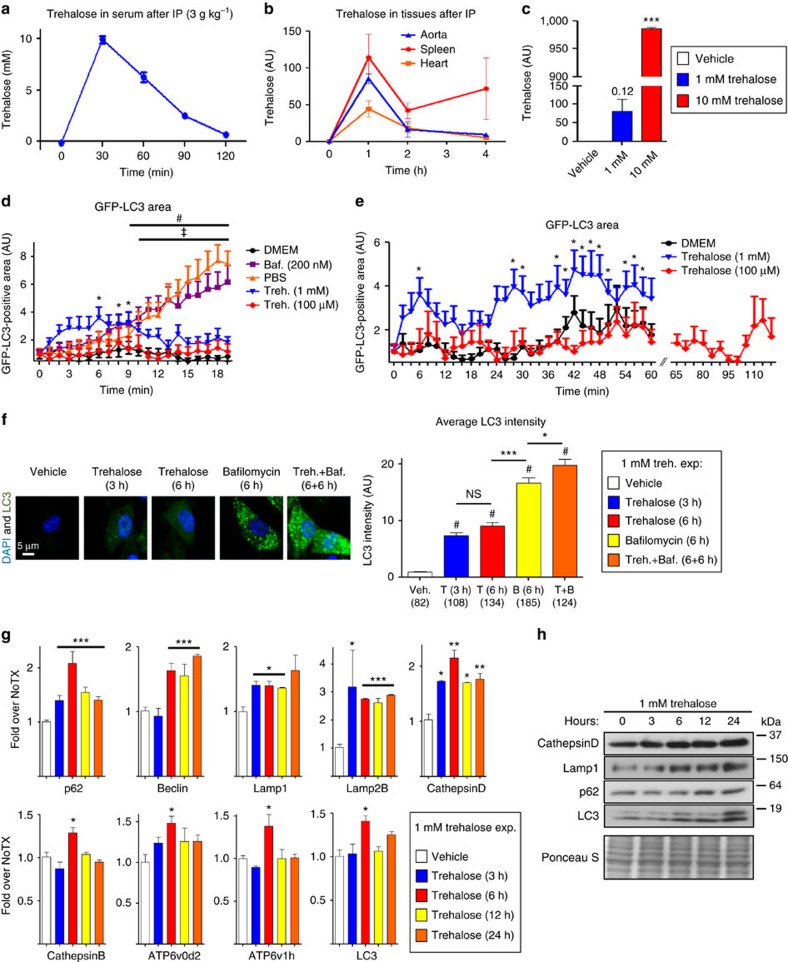
Figure 7. Trehalose induces autophagy and the transcription of autophagy–lysosomal genes in macrophages.
(a,b) Time course of serum and tissue trehalose levels from wild-type mice (n≥4) after trehalose administration (3 g kg−1 i.p.) by colorimetric method and mass spectrometry, respectively. (c) Macrophages were treated with vehicle or trehalose at indicated concentrations for 3 h and intracellular trehalose levels measured by mass spectrometry (n=2 independent wells). (d) GFP-LC3-expressing macrophages were imaged live every 30 s while being incubated in DMEM (control)±bafilomycin (200 nM), PBS (starvation) or trehalose (1 mM, 100 μM) for 20 min. GFP-LC3-positive area was quantified (n≥10 cells for each treatment) and plotted relative to 0 min. No significant difference seen for DMEM and 100 μM trehalose treatments. Trehalose (1 mM), bafilomycin and PBS significance is demarcated by *, # and ‡, respectively (P<0.05 for all cases). (e) Protocol as in d but macrophages were imaged live for 1 h (DMEM and 1 mM trehalose) or 2 h (100 μM trehalose). No significant difference seen for DMEM and 100 μM trehalose treatments. *P<0.05 for 1 mM trehalose treatment time points. (f) Wild-type macrophages were incubated with trehalose (1 mM; 3 and 6 h), bafilomycin (200 nM; 6 h) or both (6 h trehalose pretreatment and 6 h co-incubation) and stained with LC3 antibody and DAPI. Representative images are shown at left and quantification of average LC3 intensity with each condition at right (number of cells under each bar). #shows significant difference compared to vehicle (using analysis of variance (ANOVA) followed by Tukey's multiple comparison test; scale bar, 5 μm). (g) Wild-type macrophages were treated with 1 mM trehalose for indicated time points and transcripts of autophagy–lysosomal genes detected by qPCR (n≥3 independent wells for each gene). (h) Western blot analysis of Cathepsin D, Lamp1, p62 and LC3 in macrophages after 1 mM trehalose treatment for indicated times. Ponceau S staining used as loading control. For graphs in c,f,g, data are presented as mean±s.e.m. *P<0.05, **P<0.01, ***P<0.001, NS: not significant, two-tailed unpaired t-test compared to zero time point or vehicle, except f.

