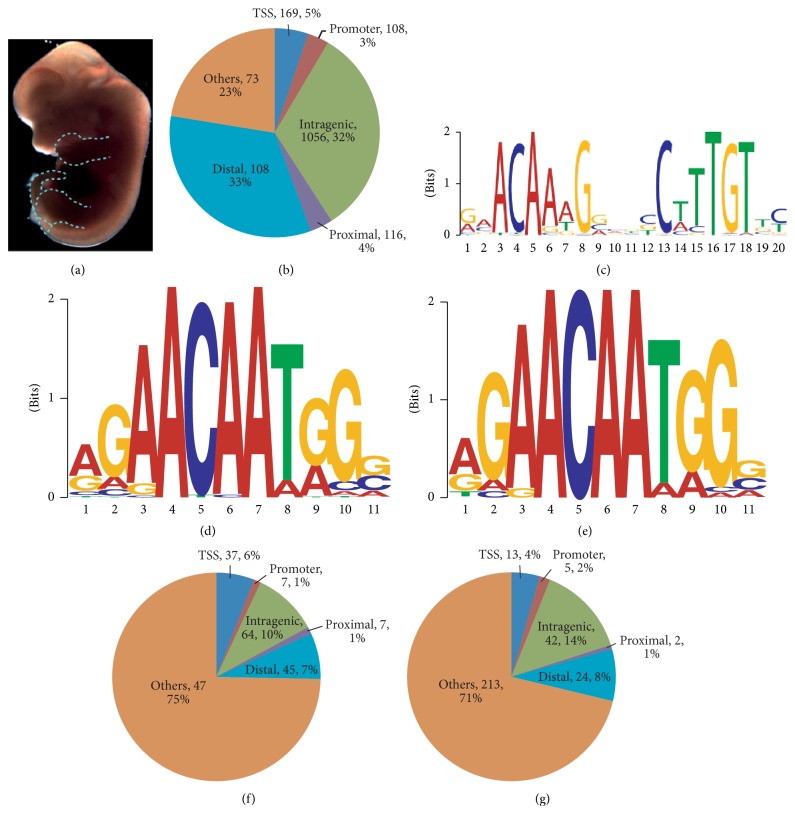
Figure 3.
ChIP-seq results for Sox9, Sox5, and Sox6. (a) Dissected tissues of the E13.5 embryo used for ChIP are indicated by the dotted blue lines. (b) Distribution of the Sox9 binding sites with respect to their nearest genes. (c) Primary Sox9 motif found shows Sox9 acts as a homodimer with the binding sites in opposite orientation. (d) Primary motif found from the Sox5 binding profile. (e) Primary motif found from the Sox6 binding profile. (f) Distribution of the Sox5 binding sites with respect to their nearest genes. (g) Distribution of the Sox6 binding sites with respect to their nearest genes (see also Figure S3 and Table S3).

