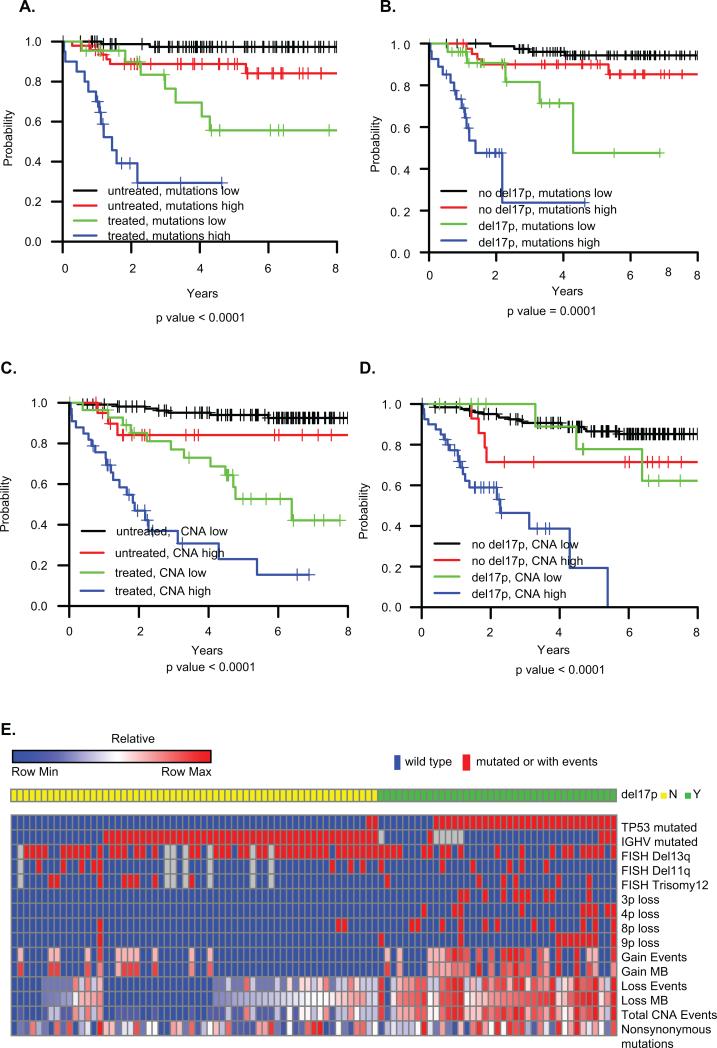
Figure 1. Overall survival and heatmap characteristics of patients.
A) OS by total number of mutations and treatment status at sampling; (B) OS by total number of mutations and del(17p) status. (C) OS by total CNA events and treatment status at sampling. (D) OS by total CNA events and del(17p) status. Mutations low: mutations < 21; mutations high: mutations >=21. CNAs low: CNA < 4; CNA high: CNA >=4. The optimal cutoff values for total number of mutations and CNAs were identified using the method of recursive partitioning for survival trees. (E) Heatmap characteristics of the 99 patients with both SNP and WES profiles. The first 9 rows are indicated by presence (red) or absence (blue) of TP53 mutation, IGHV mutation or abnormal cytogenetics by FISH. CNA events, weights and nonsynonymous mutations represent percentiles of ranks across 99 observations. i.e., the highest value in each row is denoted as 1 (100th percentile) and the lowest value is denoted as 0.01 (1th percentile).

