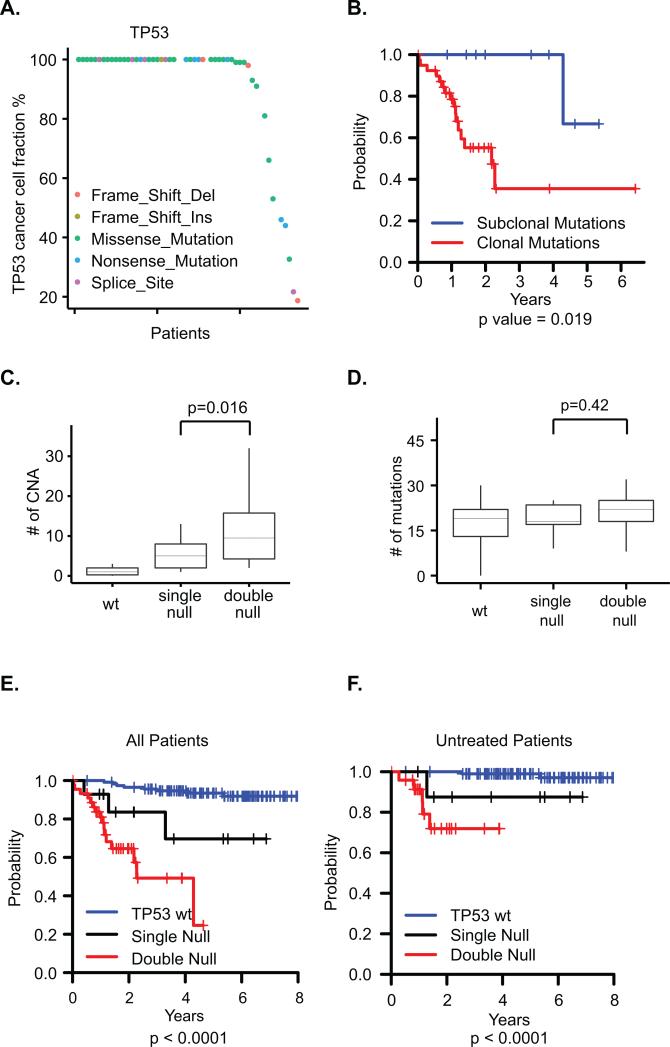
Figure 2. Analysis of TP53 disruptions.
A. Cancer cell fractions of the TP53 mutations in each patient. B. Kaplan-Meier curves of OS by clonality status of TP53 mutations. C. Relationship of CNAs and TP53 disruptions. wt: no TP53 mutation or deletion; single null: monoallelic TP53 mutation or del(17p) deletion; double null: biallelic disruption. D. Relationship of somatic mutations and TP53 disruptions. E-F. Dose-dependent impact of TP53 disruption on overall survival in all patients (E) or previously untreated patients (F).

