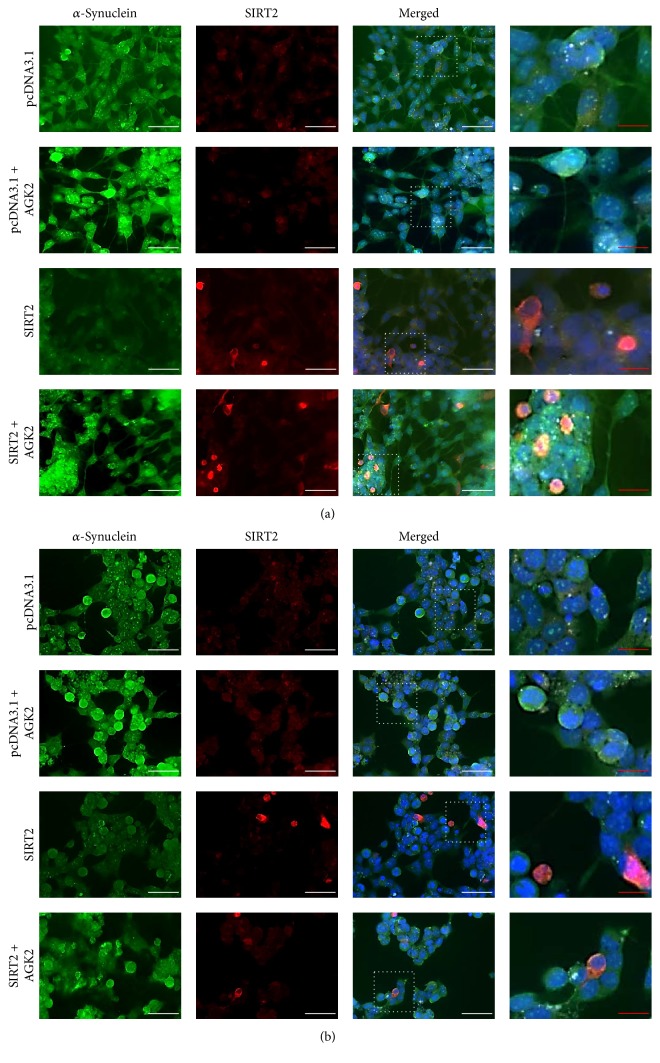
Figure 4.
Localisation of SIRT2 and α-synuclein in rotenone treated SH-SY5Y cells. Cellular distribution of SIRT2 and phospho-α-synuclein was determined using fluorescent immunocytochemistry. Images show α-synuclein immunostaining, SIRT2 immunostaining, and all staining merged including DAPI in 20 μM rotenone treated cells. Scale bars, white scale bar = 50 μM and red scale bar = 20 μM; magnification: 40x. (a) represents 0.2% DMSO and (b) represents 20 μM rotenone treated SH-SY5Y cells.

